Doughnut Chart in .NET MAUI Chart
24 Nov 20225 minutes to read
DoughnutSeries is similar to PieSeries. It is used to show the relationship between parts of data and whole data. To render a DoughnutSeries in circular chart, create an instance of the DoughnutSeries and add it to the Series collection property of SfCircularChart.
NOTE
The circular chart has Series as its default content.
<chart:SfCircularChart>
    <chart:DoughnutSeries ItemsSource="{Binding Data}"
                        XBindingPath="Product"
                        YBindingPath="SalesRate" />
</chart:SfCircularChart>
SfCircularChart chart = new SfCircularChart();
DoughnutSeries series = new DoughnutSeries();
series.XBindingPath = "Product";
series.YBindingPath = "SalesRate";
chart.Series.Add(series);
Inner Radius
The InnerRadius property of doughnut series is used to define the inner circle.
<chart:SfCircularChart>
    <chart:DoughnutSeries ItemsSource="{Binding Data}"
						InnerRadius="0.7"
						XBindingPath="Product"
						YBindingPath="SalesRate" />
</chart:SfCircularChart>
SfCircularChart chart = new SfCircularChart();
DoughnutSeries series = new DoughnutSeries();
series.XBindingPath = "Product";
series.YBindingPath = "SalesRate";
series.InnerRadius = 0.7;
chart.Series.Add(series);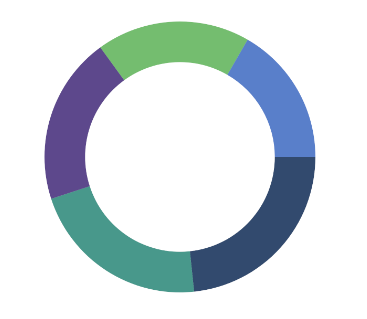
Semi Doughnut
By using the StartAngle and EndAngle properties, you can draw doughnut series in different shapes such as semi-doughnut or quarter doughnut series.
<chart:SfCircularChart>
    <chart:DoughnutSeries StartAngle="180" EndAngle="360"
                    ItemsSource="{Binding Data}"
                    XBindingPath="Product"
                    YBindingPath="SalesRate" />
</chart:SfCircularChart>
SfCircularChart chart = new SfCircularChart();
DoughnutSeries series = new DoughnutSeries();
series.XBindingPath = "Product";
series.YBindingPath = "SalesRate";
series.StartAngle = 180;
series.EndAngle = 360;
chart.Series.Add(series);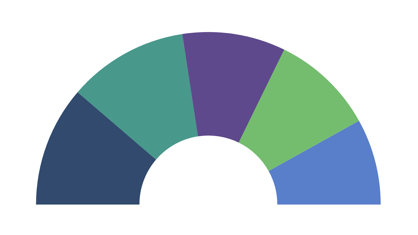
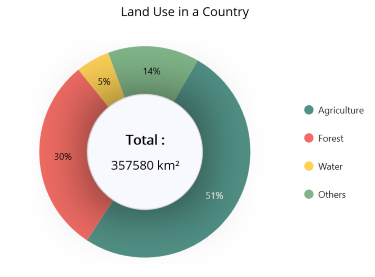
Center View
The view placed in the center of the doughnut chart is useful for sharing additional information about the doughnut chart. Any view can be added to the center of the doughnut chart using the CenterView property of DoughnutSeries. The binding context of the CenterView will be the respective doughnut series.
Center Hole Size
The CenterHoleSize property of DoughnutSeries is used to get the diameter value of the center hole. Using the CenterHoleSize, we can protect the view in the doughnut center from overlapping with the series.
<chart:SfCircularChart>
    <chart:DoughnutSeries ItemsSource="{Binding Data}" XBindingPath="Name" YBindingPath="Value"/>
        <chart:DoughnutSeries.CenterView>
                <Border HeightRequest="{Binding CenterHoleSize}" WidthRequest="{Binding CenterHoleSize}">
                    <Border.StrokeShape>
                        <RoundRectangle CornerRadius="200"/>
                    </Border.StrokeShape>
                    <StackLayout>
                        <Label Text="Total :" />
                        <Label Text="357,580 km²"/>
                    </StackLayout>
                </Border>
        </chart:DoughnutSeries.CenterView>
    </chart:DoughnutSeries>
</chart:SfCircularChart>
SfCircularChart chart = new SfCircularChart();
DoughnutSeries series = new DoughnutSeries()
series.XBindingPath = "Name";
series.YBindingPath = "Value";
Border border = new Border();
Label name = new Label();
name.Text = "Total :";
Label value = new Label()
value.Text = "357,580 km²";
StackLayout layout = new StackLayout();
border.Content = layout;
series.CenterView = border;
chart.Series.Add(series);