Step Area Chart in .NET MAUI Cartesian Chart
10 Jul 20266 minutes to read
Step Area Chart
A step area chart displays data that changes over time or across different categories.
In a step area chart, the data points are connected by horizontal and vertical lines to create a series of steps. Each step represents a specific time interval or category. The area between the steps is then filled with a color or shading. To render an area chart, create an instance of StepAreaSeries and add it to the Series collection property of the SfCartesianChart.
NOTE
Prerequisite: Ensure that the required NuGet package is installed, the necessary namespaces are imported, and the SfCartesianChart control is properly configured in your application. For detailed setup and configuration instructions, refer to the Getting Started guide.
NOTE
The Cartesian chart has Series as its default content.
<chart:SfCartesianChart>

    <chart:SfCartesianChart.XAxes>
        <chart:DateTimeAxis/>
    </chart:SfCartesianChart.XAxes>

    <chart:SfCartesianChart.YAxes>
        <chart:NumericalAxis/>
    </chart:SfCartesianChart.YAxes>

    <chart:StepAreaSeries ItemsSource="{Binding Data}"
                          XBindingPath="Month"
                          YBindingPath="Value"/>

</chart:SfCartesianChart>
SfCartesianChart chart = new SfCartesianChart();
DateTimeAxis primaryAxis = new DateTimeAxis();
chart.XAxes.Add(primaryAxis);
NumericalAxis secondaryAxis = new NumericalAxis();
chart.YAxes.Add(secondaryAxis);
StepAreaSeries series = new StepAreaSeries()
{
ItemsSource = new ViewModel().Data,
XBindingPath = "Month",
YBindingPath = "Value",
};
chart.Series.Add(series);
this.Content = chart;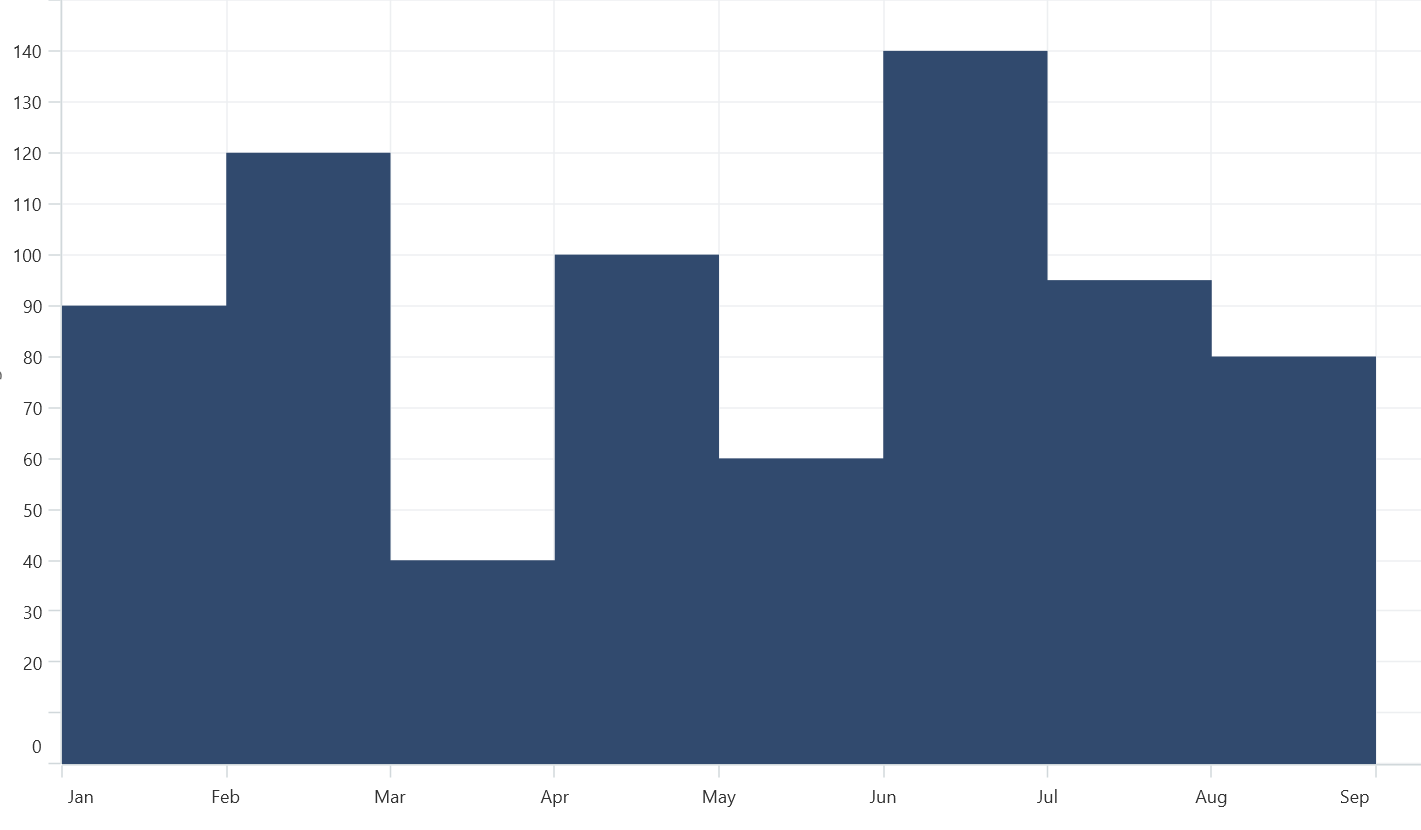
Enable Marker
A marker, also known as a symbol, determines or highlights the data point’s position. To enable markers in the series, set the ShowMarkers property to true.
<chart:SfCartesianChart>
    <!-- code omitted for brevity -->
    <chart:StepAreaSeries ItemsSource="{Binding Data}"
                          XBindingPath="Month"
                          YBindingPath="Value"
                          ShowMarkers="True"/>

</chart:SfCartesianChart>
SfCartesianChart chart = new SfCartesianChart();
// code omitted for brevity
StepAreaSeries series = new StepAreaSeries()
{
ItemsSource = new ViewModel().Data,
XBindingPath = "Month",
YBindingPath = "Value",
ShowMarkers = true,
};
chart.Series.Add(series);
this.Content = chart;Marker customization
To change the series markers appearance, set the MarkerSettings property to a ChartMarkerSettings instance. The following properties are used to customize marker appearance.
-
Type, of type
ShapeType, describes the shape of the series marker. The default value of this property is ShapeType.Circle. -
Stroke, of type
Brush, indicates the brush used to paint the marker border. -
StrokeWidth, of type
double, indicates the width of the marker border. -
Fill, of type
Brush, indicates the color of the marker. -
Width, of type
double, indicates the width of the marker. -
Height, of type
double, indicates the height of the marker.
<chart:SfCartesianChart>
    <!-- code omitted for brevity -->
    <chart:StepAreaSeries XBindingPath="Month"
                          YBindingPath="Value"
                          ItemsSource="{Binding Data}"
                          ShowMarkers="True">
        <chart:StepAreaSeries.MarkerSettings>
            <chart:ChartMarkerSettings Type="Diamond"
                                        Fill="Brown"
                                        Stroke="Black"
                                        StrokeWidth="1"
                                        Height="8"
                                        Width="8"/>
        </chart:StepAreaSeries.MarkerSettings>
    </chart:StepAreaSeries>
</chart:SfCartesianChart>
SfCartesianChart chart = new SfCartesianChart();
// code omitted for brevity
ChartMarkerSettings chartMarker= new ChartMarkerSettings()
{
Type = ShapeType.Diamond,
Fill = Colors.Brown,
Stroke = Colors.Black,
StrokeWidth = 1,
Height = 8,
Width = 8
};
StepAreaSeries series = new StepAreaSeries()
{
XBindingPath = "Month",
YBindingPath = "Value",
ItemsSource = new ViewModel().Data,
ShowMarkers = true,
MarkerSettings = chartMarker,
};
chart.Series.Add(series);
this.Content = chart;