How to
13 Feb 201915 minutes to read
Public methods
Refresh the pivot grid with modified report
The refreshControl method is used to re-render the pivot chart component with specified data source and properties initially.
<div id="PivotChart1"></div>

<script>
    $("#PivotChart1").ejPivotChart();
    var pivotChartObj = $("#PivotChart1").data("ejPivotChart");
    pivotChartObj.refreshControl();
</script>
Generate JSON object from OLAP cube
The generateJSON method is used to render the pivot chart component with the pivot engine from the OLAP cube.
<div id="PivotChart1"></div>

<script>
    $("#PivotChart1").ejPivotChart();
    var pivotChartObj = $("#PivotChart1").data("ejPivotChart");
    pivotChartObj.generateJSON(baseObj, pivotEngineObj);
</script>
Refresh the pivot chart with paging
The refreshPagedPivotChart method is used to render the pivot chart control with the given axis and the page number.
<div id="PivotChart1"></div>

<script>
    $("#PivotChart1").ejPivotChart();
    var pivotChartObj = $("#PivotChart1").data("ejPivotChart");
    pivotChartObj.refreshPagedPivotchart("series", 2);
</script>
Explicit asynchronous invoke
The doAjaxPost method is used to post an asynchronous HTTP (AJAX) request.
<div id="PivotChart1"></div>

<script>
    $("#PivotChart1").ejPivotChart();
    var pivotChartObj = $("#PivotChart1").data("ejPivotChart");
    pivotChartObj.doAjaxPost("POST", "/PivotService/Initialize", { "key", "Hello World" }, successEvent, null);
</script>
Destroying the object of pivot chart
The destroy method is used to destroy the pivot chart widget associated events that are bound using “this._on” and bring the control to pre-init state.
<div id="PivotChart1"></div>

<script>
    $("#PivotChart1").ejPivotChart();
    var pivotChartObj = $("#PivotChart1").data("ejPivotChart");
    pivotChartObj.destroy();
</script>
Getting JSON records from control object
The getJSONRecords method is used to return the JSON records that are formed to render the pivot chart control.
<div id="PivotChart1"></div>

<script>
    $("#PivotChart1").ejPivotChart();
    var pivotChartObj = $("#PivotChart1").data("ejPivotChart");
    pivotChartObj.getJSONRecords();
</script>
Setting JSON records to control object
The setJSONRecords method is used to set the JSON records to render the pivot chart control.
<div id="PivotChart1"></div>

<script>
    $("#PivotChart1").ejPivotChart();
    var pivotChartObj = $("#PivotChart1").data("ejPivotChart");
    pivotChartObj.setJSONRecords(pivotChartObj.getJSONRecords());
</script>
Rendering the widget with pre-defined JSON records
The renderChartFromJSON method is used to render the PivotChart widget with predefined JSON records available at that instant.
<div id="PivotChart1"></div>

<script>
    $("#PivotChart1").ejPivotChart();
    var pivotChartObj = $("#PivotChart1").data("ejPivotChart");
    pivotChartObj.renderControlFromJSON({ pivotChartObj.getJSONRecords() });
</script>
Getting the current OLAP report
You can get the current OLAP report along with axis information using the getOlapReport method.
<div id="PivotChart1"></div>

<script>
    $("#PivotChart1").ejPivotChart();
    var pivotChartObj = $("#PivotChart1").data("ejPivotChart");
    var report = pivotChartObj.getOlapReport();
</script>
Setting the OLAP report
You can set the OLAP report along with axis information using the setOlapReport method.
<div id="PivotChart1"></div>

<script>
    $("#PivotChart1").ejPivotChart();
    var pivotChartObj = $("#PivotChart1").data("ejPivotChart");
    var report = pivotChartObj.setOlapReport(olapReportObj);
</script>
Explicit asynchronous post
The doPostBack method is used to perform an asynchronous HTTP (AJAX) post operation.
<div id="PivotChart1"></div>

<script>
    $("#PivotChart1").ejPivotChart();
    var pivotChartObj = $("#PivotChart1").data("ejPivotChart");
    pivotChartObj.doPostBack("/PivotService/Initialize", { "key", "Hello World" });
</script>
Rendering the widget using JSON records and report returned from the service
The renderControlSuccess method is used to receive the JSON records and report from the service, which is utilized for rendering the widget.
<div id="PivotChart1"></div>

<script>
    $("#PivotChart1").ejPivotChart();
    var pivotChartObj = $("#PivotChart1").data("ejPivotChart");
    pivotChartObj.renderControlSuccess({ "OlapReport": pivotChartObj.getOlapReport(), "JsonRecords": pivotChartObj.getJSONRecords() });
</script>
Events
Invoking event in client-side after service invoke
The afterServiceInvoke event is triggered when it is reached the client-side after any AJAX request.
$("#PivotChart1").ejPivotChart({

            // after service invoke event
            afterServiceInvoke: function (args) {

            },

            //...
        });
Invoking event in client-side before service invoke
The beforeServiceInvoke event is triggered before any AJAX request is passed from the pivot chart to service methods.
$("#PivotChart1").ejPivotChart({

            // before service invoke event
            beforeServiceInvoke: function (args) {

            },

            //...
        });
Triggering event after performing drill operation
The drillSuccess event is triggered when performing the drill up/down operation in the pivot chart control.
$("#PivotChart1").ejPivotChart({

            // drill success event
            drillSuccess: function (args) {

            },

            //...
        });
Triggering event before exporting
The beforeExport event is triggered before performing the export operation in the the pivot chart.
$("#PivotChart1").ejPivotChart({

            // before export event
            beforeExport: function (args) {

            },

            //...
        });
Triggering event before the pivot chart loaded
The load event is triggered when the pivot chart is started to render.
$("#PivotChart1").ejPivotChart({

            // load event
            load: function (args) {

            },

            //...
        });
Triggering event on successful completion of AJAX request
The renderSuccess event is triggered when the AJAX request returns successfully at the client-side.
$("#PivotChart1").ejPivotChart({

            //render success event
            renderSuccess: function(args) {

    },

            //...
});
Triggering event after the control rendered
The renderComplete event is triggered after the pivot client is rendered completely.
$("#PivotChart1").ejPivotChart({

            //render complete event
            renderComplete: function(args) {

        },

            //...
    });
Triggering event on failure of AJAX request
The renderFailure event is triggered when any error occurred during the AJAX request.
$("#PivotChart1").ejPivotChart({

            //render failure event
            renderFailure: function(args) {

        },

            //...
    });
Members
Enabling XMLHttpRequest object for CORS
Allows you to enable “withCredentials” property inside XMLHttpRequest object for CORS(Cross-Origin Resource Sharing) request. This feature can be enabled by enableXHRCredentials property.
<script type="text/javascript">
        $(function() {
            $("#PivotChart1").ejPivotChart({

              enableXHRCredentials: true

            });

        });

    </script>
Enabling context menu in pivot chart
To improve user action, the context menu option in the pivot chart allows you to enable/disable the features with UI operations. This feature can be enabled by the enableContextMenu property.
<script type="text/javascript">
        $(function() {
            $("#PivotChart1").ejPivotChart({

              enableContextMenu: true

            });

        });


    </script>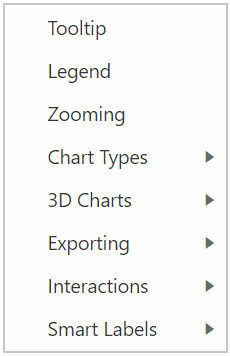
The following are the available features in the context menu:
-
Tooltip: It allows you to enable/disable the tooltip. -
Legend: It allows you to show/hide the legend in the pivot chart component. -
Zooming: It allows you to zoom the chart by using the rubber band selection.

-
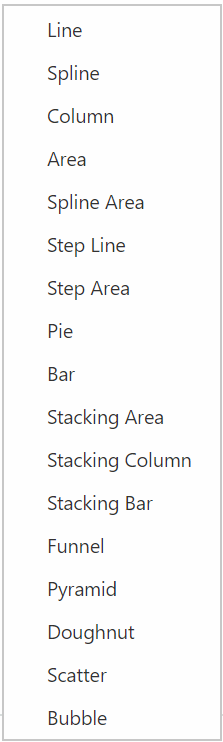
Chart types: You can choose different 2D charts by UI operations.
-
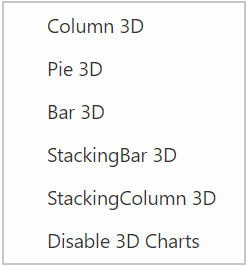
3D Charts: You can choose different 3D chart types. The “Disable 3D Charts” option is available to disable the 3D chart, and it is rendered as the respective 2D chart.
-
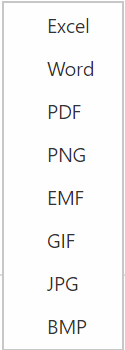
Exporting: You can export the chart in different formats given in the following image. You have to mention the export settings through thebeforeExportevent.
-
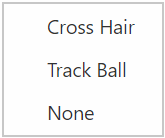
Interactions: Different types of interactions are available in the context menu to view the datum in the chart.
For more on this topic, click here
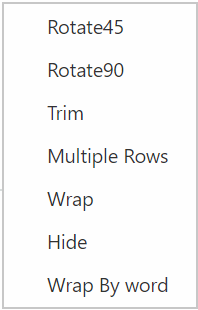
-
Smart Labels: You can customize the labels in a different view by giving the options mentioned in the following image:
Setting custom theme
You can render the pivot chart with one of the available built-in themes by using the cssClass property.
<script type="text/javascript">
        $(function() {
            $("#PivotChart1").ejPivotChart({
              cssClass: "gradient-lime"
            });

        });

    </script>
Setting custom name to service methods
The serviceMethodSettings allows you to set the custom name for methods in the WebAPI/WCF, communicated during the AJAX post. The following table will explain the service methods:
| Service methods | Description |
|---|---|
| initialize | It fetches the data required to initialize the control. |
| drillDown | It allows the drilling up/down action in the pivot chart. |
| paging | It fetches the data while navigating between pages in the pivot chart data. |
| exportPivotChart | It exports the pivot chart control at the instant to the specified format. |
Custom Format Strings
The following table describes the result on applying certain custom format over numeric values.
| Value | Custom Format String | Result |
|---|---|---|
| 10000000 | #,# | 10,000,000 |
| 10000000 | #,#.00 | 10,000,000.00 |
| 10000000 | #0.0 | 10000000.0 |
| 10000000 | $#,#;0; | $10,000,000 |
| 10000000 | #,##0.00;-#,##0.00 | 10,000,000.00 |
| 10000000 | #,##0;-#,##0 | 10,000,000 |
| 10000000 | $#,##0.00;($#,##0.00) | $10,000,000.00 |
| 10000000 | #,##0;(#,##0) | 10,000,000 |