Getting Started
17 Nov 201717 minutes to read
Before we start with the TreeMap, please refer this page for general information regarding integrating Syncfusion widget’s.
Adding JavaScript and CSS Reference
To render the TreeMap control, the following list of external dependencies are needed,
- jsRender - to render the templates
The other required internal dependencies are tabulated below,
| Files | Description/Usage |
|---|---|
| ej.core.min.js | It is referred always before using all the JS controls. |
| ej.data.min.js | Used to handle data operation and is used while binding data to the JS controls. |
| ej.treemap.min.js | TreeMap core script file which includes TreeMap related scripts files. |
NOTE
TreeMap uses one or more script files, therefore refer the
ej.web.all.min.js(which encapsulates all theejcontrols and frameworks in a single file) in the application instead of referring all the above specified internal dependencies.
To get the real appearance of the TreeMap, the dependent CSS file ej.web.all.min.css (which includes styles of all the widgets) should also needs to be referred.
Control Initialization
-
Open the command prompt in the folder ember-app or the folder in which the application is created.
-
Use the command ember generate route treemap/defaultto create template
default.hbsfile in templates folder and routerdefault.jsfile in routes folder. It also add the routing content inrouter.js. -
Use below code in
default.hbsin templates folder to render the treemap.
- Use the below code in
default.jsin routes folder to bind the model to the treemap.
import Ember from 'ember';

    export default Ember.Route.extend({
      model() {
         return {
         }
      }
    });
Populate DataSource
The dataSource property accepts the collection values as input. For example, you can provide the list of objects as input.
var treemapData = [
            { Continent: "Asia", Region: "Southern Asia", Growth: 1.32, Population: 1749046000 },
            { Continent: "Asia", Region: "Eastern Asia", Growth: 0.57, Population: 1620807000 },
            { Continent: "Asia", Region: "South-Eastern Asia", Growth: 1.20, Population: 618793000 },
            { Continent: "Asia", Region: "Western Asia", Growth: 1.98, Population: 245707000 },
            { Continent: "Asia", Region: "Central Asia", Growth: 1.43, Population: 64370000 },
            { Continent: "Europe", Region: "Europe", Growth: 0.10, Population: 742452000 },
            { Continent: "America", Region: "South America", Growth: 1.06, Population: 406740000 },
            { Continent: "America", Region: "Northern America", Growth: 0.85, Population: 355361000 },
            { Continent: "America", Region: "Central America", Growth: 1.40, Population: 167387000 },
            { Continent: "Africa", Region: "Eastern Africa", Growth: 2.89, Population: 373202000 },
            { Continent: "Africa", Region: "Western Africa", Growth: 2.78, Population: 331255000 },
            { Continent: "Africa", Region: "Northern Africa", Growth: 1.70, Population: 210002000 },
            { Continent: "Africa", Region: "Middle Africa", Growth: 2.79, Population: 135750000 },
            { Continent: "Africa", Region: "Southern Africa", Growth: 0.91, Population: 60425000 }
        ];
Refer the treemapdata.js file as illustrated in the following code example in index.html file.
<script src="scripts/treemapdata.js" type="text/javascript"></script>NOTE
Population data is referred from List of continents by population.
Initialize TreeMap
1. Create a <div> tag with a specific id and set the height and width to determine the rendering treemap’s size with ej-treemap attribute.
2. Set the dataSource attribute value as window.population_data, which contains the data details.
3. You can calculate the size of the object using weightValuePath of TreeMap.
export default Ember.Route.extend({
      model() {
         return {
            dataSource: window.population_data,
            weightValuePath: "Population",
         }
      }
    });
Running the application
- To run the application, execute below command.
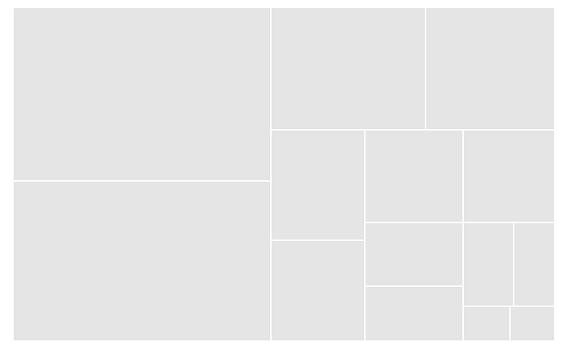
ember serve- Browse to http://localhost:4200 to see the application. And navigate to treemap sample. The component is rendered as like the below screenshot. You can make changes in the code found under app folder and the browser should auto-refresh itself while you save files.
The above code renders a treemap, with default properties.
Group with Levels
You can group TreeMap items using the levels in it.
Group Path
You can use groupPath property for every flat level of the TreeMap control. It is a path to a field on the source object that serves as the “Group” for the level specified. You can group the data based on the groupPath in the TreeMap control. When the groupPath is not specified, then the items are not grouped and the data is displayed in the order specified in the dataSource.
Group Gap
You can use groupGap property to separate the items from every flat level and to differentiate the levels mentioned in the TreeMap control.
The following code sample explains how to group TreeMap Items using ‘Levels’.
export default Ember.Route.extend({
model() {
return {
dataSource: window.population_data,
weightValuePath: "Population",
levels: [{ groupPath: "Continent", groupGap: 5}],
}
}
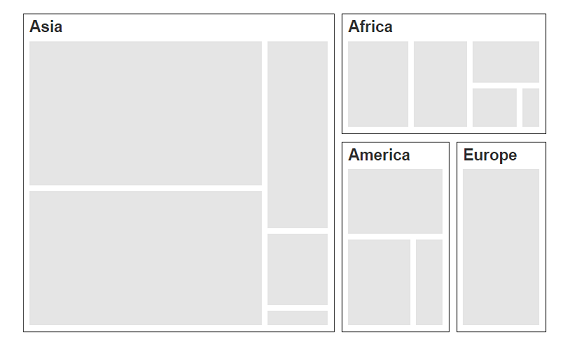
});The following screenshot displays grouping of TreeMapItems using Levels.
Customize TreeMap by Range
You can differentiate the nodes based on its value and color ranges using Range color. You can also define the color value range using from and to properties.
Color Value Path
The colorValuePath of TreeMap is a path to a field on the source object. You can determine the color for the object using colorValuePath of TreeMap.
The following code sample explains how to customize TreeMap appearance using Range.
export default Ember.Route.extend({
model() {
return {
dataSource: window.population_data,
weightValuePath: "Population",
levels: [{ groupPath: "Continent", groupGap: 5}],
colorValuePath: "Growth",
rangeColorMapping: [
{ color: "#DC562D", from: "0", to: "1" },
{ color: "#FED124", from: "1", to: "1.5" },
{ color: "#487FC1", from: "1.5", to: "2" },
{ color: "#0E9F49", from: "2", to: "3" }
]
}
}
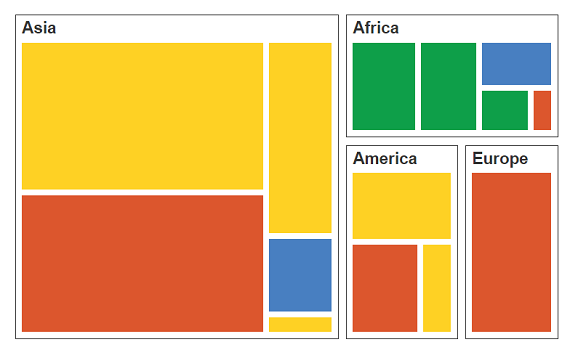
});The following screenshot displays a customized TreeMap control.
Enable Tooltip
You can enable the tooltip by setting showTooltip property to “True”. By default, it takes the property of the bound object that is referred in the weightValuePath and displays its content when the corresponding node is hovered. You can customize the template for tooltip using tooltipTemplate property.
Add the template script to .hbs file for treemap tooltip template , refer the below code snippet for tooltipTemplate
<script id="template" type="x-handlebars">
    <div style="margin-left:17px;margin-top:-45px;">
        <div style="height:auto;width:auto;background:black;border-radius:3px;opacity:1">
            <div style="margin-top:-20px;margin-left:9px;padding-top:3px;margin-right:9px;">
                <label style="margin-top:-20px;font-weight:normal;font-size:12px;color:white;font-family:Segoe UI;">Population</label>
            </div>
            <div style="height:10px;"></div>
            <div style="margin-top:-10px;margin-left:9px;margin-right:9px;padding-bottom:3px;">
                <label style="margin-top:-10px;font-weight:normal;font-size:14px;color:white;font-family:segoe ui light;">\</label>
            </div>
        </div>
    </div>
</script>export default Ember.Route.extend({
model() {
return {
dataSource: window.population_data,
weightValuePath: "Population",
levels: [{ groupPath: "Continent", groupGap: 5}],
colorValuePath: "Growth",
rangeColorMapping: [
{ color: "#DC562D", from: "0", to: "1" },
{ color: "#FED124", from: "1", to: "1.5" },
{ color: "#487FC1", from: "1.5", to: "2" },
{ color: "#0E9F49", from: "2", to: "3" }
],
showTooltip: true,
tooltipTemplate: 'template',
}
}
});Leaf ItemSettings
You can customize the Leaf level TreeMap items using leafItemSettings. The Label and tooltip values take the property of bound object that is referred in the labelPath when defined. The following code sample displays how the tooltip is enabled.
export default Ember.Route.extend({
      model() {
         return {
            dataSource: window.population_data,
            weightValuePath: "Population",
            levels: [{ groupPath: "Continent", groupGap: 5}],
            colorValuePath: "Growth",
            rangeColorMapping: [
                    { color: "#DC562D", from: "0", to: "1" },
                    { color: "#FED124", from: "1", to: "1.5" },
                    { color: "#487FC1", from: "1.5", to: "2" },
                    { color: "#0E9F49", from: "2", to: "3" }
            ],
            showTooltip: true,
            tooltipTemplate: 'template',
            leafItemSettings: { labelPath: "Region" }
         }
      }
    });
The following screenshot displays a ToolTip in a TreeMap control.
Enable Legend
You can set the color value of leaf nodes using TreeMap Legend. This legend is appropriate only for the TreeMap whose leaf nodes are colored using rangeColorMapping. You can set showLegend property value to “True” to make a legend visible.
Label for Legend
You can customize the labels of the legend item using legendLabel property of rangeColorMapping.
The following code sample illustrates how to add labels for legend in a TreeMap.
export default Ember.Route.extend({
model() {
return {
dataSource: window.population_data,
weightValuePath: "Population",
levels: [{ groupPath: "Continent", groupGap: 5}],
colorValuePath: "Growth",
rangeColorMapping: [
{ color: "#DC562D", from: "0", to: "1",legendLabel: "0 - 1 % Growth" },
{ color: "#FED124", from: "1", to: "1.5" , legendLabel: "1 - 1.5 % Growth"},
{ color: "#487FC1", from: "1.5", to: "2", legendLabel: "1.5 - 2 % Growth" },
{ color: "#0E9F49", from: "2", to: "3" , legendLabel: "2 - 3 % Growth"}
],
showTooltip: true,
tooltipTemplate: 'template',
leafItemSettings: { labelPath: "Region" },
showLegend: true,
legendSettings: {
showLegend:true,
height:38,
width:690,
},
}
}
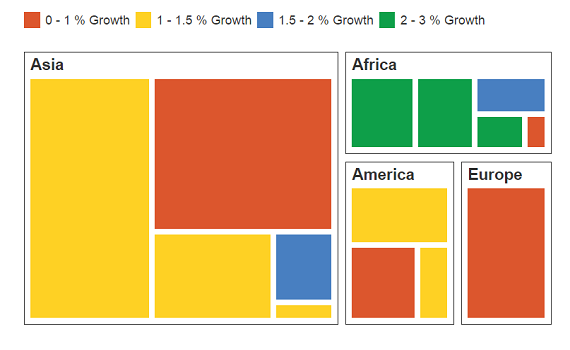
});The following screenshot displays labels in a TreeMap control.
NOTE
Population data is referred from List of continents by population.