Shape Sublayer in .NET MAUI Maps
The shape sublayer is where geographical rendering will happen for the sublayer. This is similar to the main MapShapeLayer rendering. This section explains adding a shape sublayer on the shape layer.
NOTE
Prerequisite: Ensure that the required NuGet package is installed, the necessary namespaces are imported, and the SfMaps control is properly configured in your application. For detailed setup and configuration instructions, refer to the Getting Started guide.
To learn more about the .NET MAUI Maps shape sub layer, you can check the following video.
Shape sublayer on tile layer
The Sublayers in MapTileLayer contains a collection of MapSublayer. The actual geographical rendering is done in each MapShapeSublayer. The ShapesSource property of the MapShapeSublayer is of type MapSource. The path of the .json file which contains the GeoJSON data has to be set to the ShapesSource.
The ShapeDataField property is used to refer to the unique field name in the .json file to identify each shape.
<map:SfMaps>
    <map:SfMaps.Layer>
        <map:MapTileLayer UrlTemplate = "https://tile.openstreetmap.org/{z}/{x}/{y}.png">
            <map:MapTileLayer.Sublayers>
                <map:MapShapeSublayer ShapesSource = "https://cdn.syncfusion.com/maps/map-data/africa.json"
                                       ShapeStroke = "DarkGrey"
                                       ShapeFill = "#c6c6c6">
                </map:MapShapeSublayer>
            </map:MapTileLayer.Sublayers>
        </map:MapTileLayer>
    </map:SfMaps.Layer>
</map:SfMaps>
SfMaps map = new SfMaps();
MapTileLayer tileLayer = new MapTileLayer();
tileLayer.UrlTemplate = "https://tile.openstreetmap.org/{z}/{x}/{y}.png";
MapShapeSublayer sublayer = new MapShapeSublayer();
sublayer.ShapesSource = MapSource.FromUri(new Uri("https://cdn.syncfusion.com/maps/map-data/africa.json"));
sublayer.ShapeFill = new SolidColorBrush(Color.FromRgb(198, 198, 198));
sublayer.ShapeStroke = new SolidColorBrush(Colors.DarkGrey);
tileLayer.Sublayers.Add(sublayer);
map.Layer = tileLayer;
this.Content = map;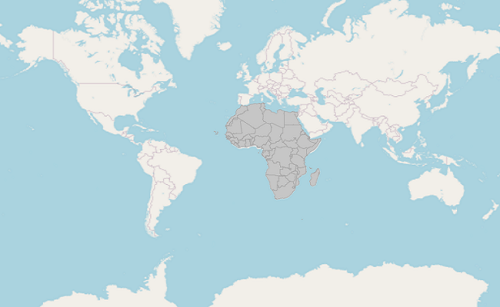
NOTE
Refer to the
MapTileLayer, for adding a tile layer inSfMaps.
Shape sublayer on shape layer
The Sublayers in MapShapeLayer contains a collection of MapSublayer. The actual geographical rendering is done in each MapShapeSublayer. The ShapesSource property of the MapShapeSublayer is of type MapSource. The path of the .json file which contains the GeoJSON data has to be set to the ShapesSource.
The ShapeDataField property is used to refer to the unique field name in the .json file to identify each shape.
<map:SfMaps>
     <map:SfMaps.Layer>
         <map:MapShapeLayer ShapesSource = "https://cdn.syncfusion.com/maps/map-data/world-map.json">
             <map:MapShapeLayer.Sublayers>
                 <map:MapShapeSublayer ShapesSource = "https://cdn.syncfusion.com/maps/map-data/africa.json" />
             </map:MapShapeLayer.Sublayers>
         </map:MapShapeLayer>
     </map:SfMaps.Layer>
 </map:SfMaps>
SfMaps maps = new SfMaps();
MapShapeLayer layer = new MapShapeLayer();
layer.ShapesSource = MapSource.FromUri(new Uri("https://cdn.syncfusion.com/maps/map-data/world-map.json"));
MapShapeSublayer sublayer = new MapShapeSublayer();
sublayer.ShapesSource = MapSource.FromUri(new Uri("https://cdn.syncfusion.com/maps/map-data/africa.json"));
sublayer.ShapeFill = new SolidColorBrush(Color.FromRgb(198, 198, 198));
sublayer.ShapeStroke = new SolidColorBrush(Colors.DarkGrey);
layer.Sublayers.Add(sublayer);
maps.Layer = layer;
this.Content = maps;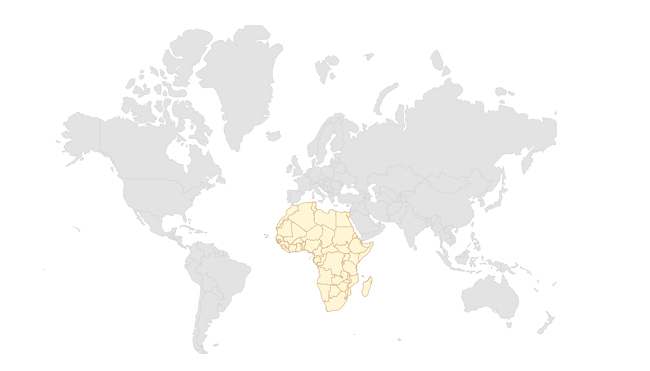
NOTE
Refer to the
MapShapeLayer, for adding a shape layer inSfMaps.
Color and stroke color
You can change the color, stroke color and stroke thickness of the shape sublayer using the ShapeFill, ShapeStroke and ShapeStrokeThickness properties.
<map:SfMaps>
    <map:SfMaps.Layer>
        <map:MapShapeLayer ShapesSource = "https://cdn.syncfusion.com/maps/map-data/world-map.json">
            <map:MapShapeLayer.Sublayers>
                <map:MapShapeSublayer ShapeStroke = "#226ac1"
                                      ShapeFill = "#bbdefa"
                                      ShapesSource = "https://cdn.syncfusion.com/maps/map-data/africa.json" />
            </map:MapShapeLayer.Sublayers>
        </map:MapShapeLayer>
    </map:SfMaps.Layer>
</map:SfMaps>
SfMaps maps = new SfMaps();
MapShapeLayer layer = new MapShapeLayer();
layer.ShapesSource = MapSource.FromUri(new Uri("https://cdn.syncfusion.com/maps/map-data/world-map.json"));
MapShapeSublayer sublayer = new MapShapeSublayer();
sublayer.ShapesSource = MapSource.FromUri(new Uri("https://cdn.syncfusion.com/maps/map-data/africa.json"));
sublayer.ShapeFill = new SolidColorBrush(Color.FromRgb(187, 222, 250));
sublayer.ShapeStroke = new SolidColorBrush(Color.FromRgb(34, 106, 193));
layer.Sublayers.Add(sublayer);
maps.Layer = layer;
this.Content = maps;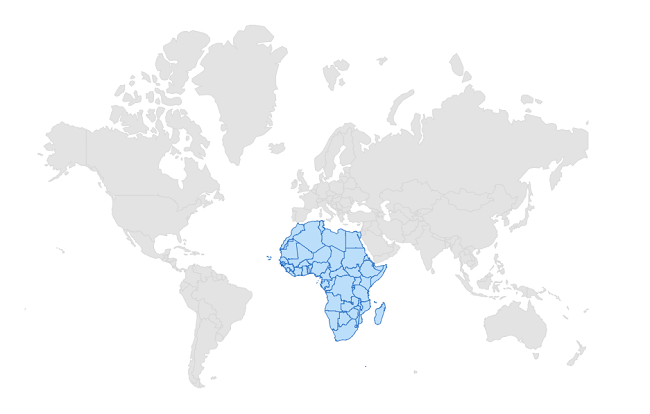
Equal color mapping
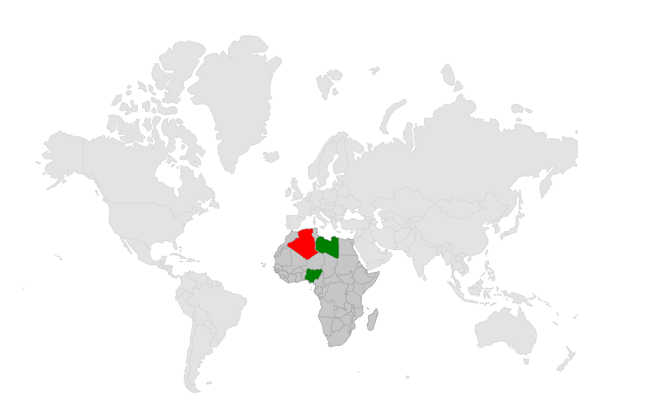
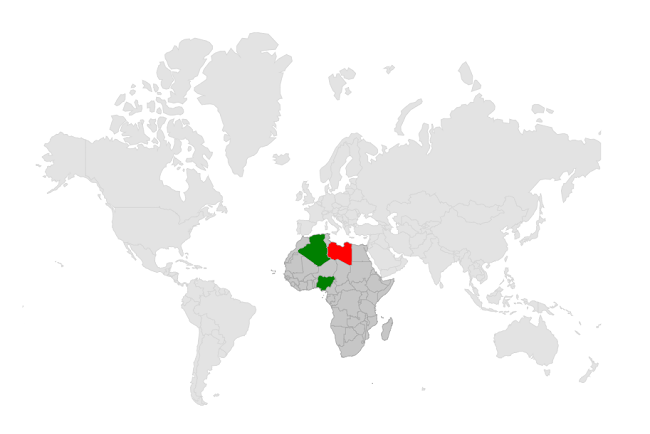
You can apply color to the sublayer shape by comparing a value from the ShapeColorValuePath with the EqualColorMapping.Value. For the matched values, the EqualColorMapping.Color will be applied to the respective shape.
<map:SfMaps>
    <map:SfMaps.Layer>
        <map:MapShapeLayer ShapesSource = "https://cdn.syncfusion.com/maps/map-data/world-map.json">
            <map:MapShapeLayer.Sublayers>
                <map:MapShapeSublayer ShapesSource = "https://cdn.syncfusion.com/maps/map-data/africa.json"
                                      ShapeStroke = "DarkGrey"
                                      ShapeFill = "#c6c6c6"
                                      ShapeDataField = "name"
                                      PrimaryValuePath = "State"
                                      ShapeColorValuePath = "Storage">
                    <map:MapShapeSublayer.ColorMappings>
                        <map:EqualColorMapping Color = "Red"
                                               Value = "Low" />
                        <map:EqualColorMapping Color = "Green"
                                               Value = "High" />
                    </map:MapShapeSublayer.ColorMappings>
                </map:MapShapeSublayer>
            </map:MapShapeLayer.Sublayers>
        </map:MapShapeLayer>
    </map:SfMaps.Layer>
</map:SfMaps>
public MainPage()
{
InitializeComponent();
ViewModel viewModel = new ViewModel();
this.BindingContext = viewModel;
SfMaps maps = new SfMaps();
MapShapeLayer layer = new MapShapeLayer();
layer.ShapesSource = MapSource.FromUri(new Uri("https://cdn.syncfusion.com/maps/map-data/world-map.json"));
MapShapeSublayer sublayer = new MapShapeSublayer();
sublayer.ShapesSource = MapSource.FromUri(new Uri("https://cdn.syncfusion.com/maps/map-data/africa.json"));
sublayer.ShapeFill = new SolidColorBrush(Color.FromRgb(198, 198, 198));
sublayer.ShapeStroke = new SolidColorBrush(Colors.DarkGrey);
sublayer.DataSource = viewModel.Data;
sublayer.PrimaryValuePath = "State";
sublayer.ShapeDataField = "name";
sublayer.ShapeColorValuePath = "Storage";
EqualColorMapping colorMapping = new EqualColorMapping();
colorMapping.Color = Colors.Red;
colorMapping.Value = "Low";
EqualColorMapping colorMapping1 = new EqualColorMapping();
colorMapping1.Color = Colors.Green;
colorMapping1.Value = "High";
sublayer.ColorMappings.Add(colorMapping);
sublayer.ColorMappings.Add(colorMapping1);
layer.Sublayers.Add(sublayer);
maps.Layer = layer;
this.Content = maps;
}
public class ViewModel
{
public ObservableCollection<Model> Data { get; set; }
public ViewModel()
{
Data = new ObservableCollection<Model>();
Data.Add(new Model("Algeria", "Low"));
Data.Add(new Model("Nigeria", "High"));
Data.Add(new Model("Libya", "High"));
}
}
public class Model
{
public string State { get; set; }
public string Storage { get; set; }
public Model(string state, string storage)
{
State = state;
Storage = storage;
}
}
Range color mapping
You can apply color to the sublayer shapes based on whether the value from ShapeColorValuePath falls within the RangeColorMapping.From and RangeColorMapping.To. Then, the RangeColorMapping.Color will be applied to the respective shape.
<map:SfMaps>
    <map:SfMaps.Layer>
        <map:MapShapeLayer ShapesSource = "https://cdn.syncfusion.com/maps/map-data/world-map.json">
            <map:MapShapeLayer.Sublayers>
                <map:MapShapeSublayer ShapesSource = "https://cdn.syncfusion.com/maps/map-data/africa.json"
                                      ShapeStroke = "DarkGrey"
                                      ShapeFill = "#c6c6c6"
                                      ShapeDataField = "name"
                                      PrimaryValuePath = "State"
                                      ShapeColorValuePath = "Count">
                    <map:MapShapeSublayer.ColorMappings>
                        <map:RangeColorMapping Color = "Red"
                                               From = "0" To = "100" />
                        <map:RangeColorMapping Color = "Green"
                                               From = "101" To = "300" />
                    </map:MapShapeSublayer.ColorMappings>
                </map:MapShapeSublayer>
            </map:MapShapeLayer.Sublayers>
        </map:MapShapeLayer>
    </map:SfMaps.Layer>
</map:SfMaps>
public MainPage()
{
InitializeComponent();
ViewModel viewModel = new ViewModel();
this.BindingContext = viewModel;
SfMaps maps = new SfMaps();
MapShapeLayer layer = new MapShapeLayer();
layer.ShapesSource = MapSource.FromUri(new Uri("https://cdn.syncfusion.com/maps/map-data/world-map.json"));
MapShapeSublayer sublayer = new MapShapeSublayer();
sublayer.ShapesSource = MapSource.FromUri(new Uri("https://cdn.syncfusion.com/maps/map-data/africa.json"));
sublayer.ShapeFill = new SolidColorBrush(Color.FromRgb(198, 198, 198));
sublayer.ShapeStroke = new SolidColorBrush(Colors.DarkGrey);
sublayer.DataSource = viewModel.Data;
sublayer.PrimaryValuePath = "State";
sublayer.ShapeDataField = "name";
sublayer.ShapeColorValuePath = "Count";
RangeColorMapping colorMapping = new RangeColorMapping();
colorMapping.Color = Colors.Red;
colorMapping.From = 0;
colorMapping.To = 100;
RangeColorMapping colorMapping1 = new RangeColorMapping();
colorMapping1.Color = Colors.Green;
colorMapping1.From = 101;
colorMapping1.To = 300;
sublayer.ColorMappings.Add(colorMapping);
sublayer.ColorMappings.Add(colorMapping1);
layer.Sublayers.Add(sublayer);
maps.Layer = layer;
this.Content = maps;
}
public class ViewModel
{
public ObservableCollection<Model> Data { get; set; }
public ViewModel()
{
Data = new ObservableCollection<Model>();
Data.Add(new Model("Algeria", 196));
Data.Add(new Model("Nigeria", 280));
Data.Add(new Model("Libya", 45));
}
}
public class Model
{
public String State { get; set; }
public double Count { get; set; }
public Model(string state, double count)
{
State = state;
Count = count;
}
}
Enable data labels and its customization
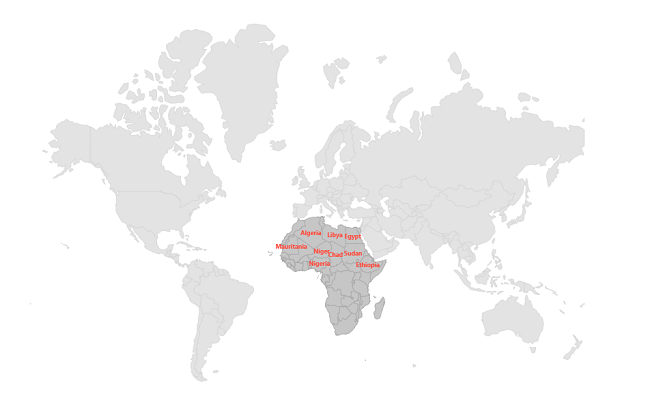
You can enable data labels to the shape sublayer using the ShowDataLabels and DataLabelPath properties. The ShowDataLabels is used to control the visibility of data labels, the DataLabelPath is used to decide which underlying property has to be displayed as data labels. The default value of ShowDataLabels is false.
<map:SfMaps>
    <map:SfMaps.Layer>
        <map:MapShapeLayer ShapesSource = "https://cdn.syncfusion.com/maps/map-data/world-map.json">
            <map:MapShapeLayer.Sublayers>
                <map:MapShapeSublayer ShapesSource = "https://cdn.syncfusion.com/maps/map-data/africa.json"
                                      ShapeStroke = "DarkGrey"
                                      ShapeFill = "#c6c6c6"
                                      ShapeDataField = "name"
                                      PrimaryValuePath = "State"
                                      ShowDataLabels = "True">
                    <map:MapShapeSublayer.DataLabelSettings>
                        <map:MapDataLabelSettings DataLabelPath = "State" >
                        <map:MapDataLabelSettings.DataLabelStyle>
                            <map:MapLabelStyle FontSize = "6"
                                               TextColor = "#ff4e41"
                                               FontAttributes = "Bold" />
                        </map:MapDataLabelSettings.DataLabelStyle>
                            </map:MapDataLabelSettings>
                    </map:MapShapeSublayer.DataLabelSettings>
                </map:MapShapeSublayer>
            </map:MapShapeLayer.Sublayers>
        </map:MapShapeLayer>
    </map:SfMaps.Layer>
</map:SfMaps>
public SublayerDataLabels()
{
InitializeComponent();
ViewModel viewModel = new ViewModel();
this.BindingContext = viewModel;
SfMaps maps = new SfMaps();
MapShapeLayer layer = new MapShapeLayer();
layer.ShapesSource = MapSource.FromUri(new Uri("https://cdn.syncfusion.com/maps/map-data/world-map.json"));
MapShapeSublayer sublayer = new MapShapeSublayer();
sublayer.ShapesSource = MapSource.FromUri(new Uri("https://cdn.syncfusion.com/maps/map-data/africa.json"));
sublayer.ShapeFill = Color.FromRgb(198, 198, 198);
sublayer.ShapeStroke = Colors.DarkGray;
sublayer.DataSource = viewModel.Data;
sublayer.PrimaryValuePath = "State";
sublayer.ShapeDataField = "name";
sublayer.ShowDataLabels = true;
sublayer.DataLabelSettings = new MapDataLabelSettings()
{
DataLabelPath = "State",
DataLabelStyle = new MapLabelStyle()
{
FontSize = 6,
FontAttributes = FontAttributes.Bold,
TextColor = Color.FromRgb(255, 78, 65)
},
};
layer.Sublayers.Add(sublayer);
maps.Layer = layer;
this.Content = maps;
}
public class ViewModel
{
public ObservableCollection<Model> Data { get; set; }
public ViewModel()
{
Data = new ObservableCollection<Model>();
Data.Add(new Model("Algeria", Colors.Green));
Data.Add(new Model("Libya", Colors.Teal));
Data.Add(new Model("Egypt", Colors.Blue));
Data.Add(new Model("Niger", Colors.Indigo));
Data.Add(new Model("Nigeria", Colors.MediumPurple));
Data.Add(new Model("Chad", Colors.LightGreen));
Data.Add(new Model("Sudan", Colors.IndianRed));
Data.Add(new Model("Mauritania", Colors.Orange));
Data.Add(new Model("South Sudan", Colors.Lime));
Data.Add(new Model("Ethiopia", Colors.GreenYellow));
}
}
public class Model
{
public String State { get; set; }
public Color Color { get; set; }
public Model(string state, Color color)
{
State = state;
Color = color;
}
}
Add bubbles to the sublayer
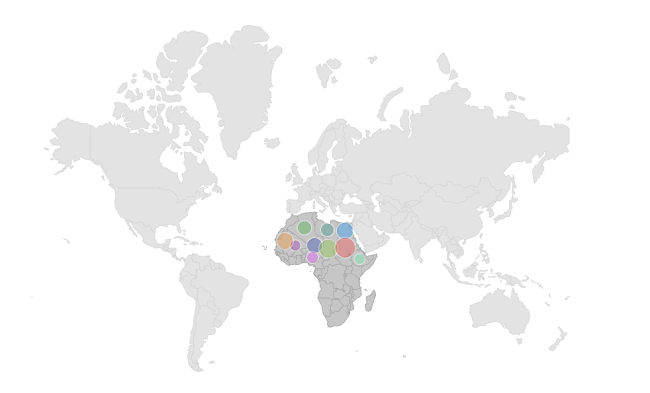
You can enable bubbles to the shape sublayer using the ShowBubbles property. You can customize the bubbles appearance using the BubbleSettings property. This property is used to specify the value based on which the bubble’s size has to be rendered.
NOTE
Refer to the
Bubblessection, to know more about the bubbles customization.
<map:SfMaps>
    <map:SfMaps.Layer>
        <map:MapShapeLayer ShapesSource = "https://cdn.syncfusion.com/maps/map-data/world-map.json">
            <map:MapShapeLayer.Sublayers>
                <map:MapShapeSublayer ShapesSource = "https://cdn.syncfusion.com/maps/map-data/africa.json"
                                      ShapeStroke = "DarkGrey"
                                      ShapeFill = "#c6c6c6"
                                      ShapeDataField = "name"
                                      DataSource = "{Binding Data}"
                                      PrimaryValuePath = "State"
                                      ShowBubbles = "True">
                    <map:MapShapeSublayer.BubbleSettings>
                        <map:MapBubbleSettings ColorValuePath = "Color"
                                               SizeValuePath = "Size"
                                               MinSize = "10"
                                               MaxSize = "20">
                        </map:MapBubbleSettings>
                    </map:MapShapeSublayer.BubbleSettings>
                </map:MapShapeSublayer>
            </map:MapShapeLayer.Sublayers>
        </map:MapShapeLayer>
    </map:SfMaps.Layer>
</map:SfMaps>
public BubblesSubUG()
{
InitializeComponent();
ViewModel viewModel = new ViewModel();
this.BindingContext = viewModel;
SfMaps maps = new SfMaps();
MapShapeLayer layer = new MapShapeLayer();
layer.ShapesSource = MapSource.FromUri(new Uri("https://cdn.syncfusion.com/maps/map-data/world-map.json"));
MapShapeSublayer sublayer = new MapShapeSublayer();
sublayer.ShapesSource = MapSource.FromUri(new Uri("https://cdn.syncfusion.com/maps/map-data/africa.json"));
sublayer.ShapeFill = Color.FromRgb(198, 198, 198);
sublayer.ShapeStroke = Colors.DarkGray;
sublayer.DataSource = viewModel.Data;
sublayer.PrimaryValuePath = "State";
sublayer.ShapeDataField = "name";
sublayer.ShowBubbles = true;
MapBubbleSettings bubbleSetting = new MapBubbleSettings()
{
ColorValuePath = "Color",
SizeValuePath = "Size",
MinSize = 10,
MaxSize = 20
};
sublayer.BubbleSettings = bubbleSetting;
layer.Sublayers.Add(sublayer);
maps.Layer = layer;
this.Content = maps;
}
public class ViewModel
{
public ObservableCollection<Model> Data { get; set; }
public ViewModel()
{
Data = new ObservableCollection<Model>();
Data.Add(new Model("Algeria", Color.FromRgb(80, 175, 80), 36232));
Data.Add(new Model("Libya", Color.FromRgb(64, 150, 137), 34121));
Data.Add(new Model("Egypt", Color.FromRgb(48, 150, 243), 43453));
Data.Add(new Model("Mali", Color.FromRgb(157, 59, 176), 28123));
Data.Add(new Model("Niger", Color.FromRgb(63, 81, 181), 40111));
Data.Add(new Model("Nigeria", Color.FromRgb(225, 87, 249), 30232));
Data.Add(new Model("Chad", Color.FromRgb(139, 194, 74), 48132));
Data.Add(new Model("Sudan", Color.FromRgb(238, 79, 79), 52654));
Data.Add(new Model("Mauritania", Color.FromRgb(243, 151, 62), 42231));
Data.Add(new Model("South Sudan", Color.FromRgb(198, 198, 198), 40421));
Data.Add(new Model("Ethiopia", Color.FromRgb(109, 240, 174), 27198));
}
}
public class Model
{
public String State { get; set; }
public Color Color { get; set; }
public double Size { get; set; }
public Model(string state, Color color, double size)
{
State = state;
Color = color;
Size = size;
}
}
Enable tooltip for shape sublayer
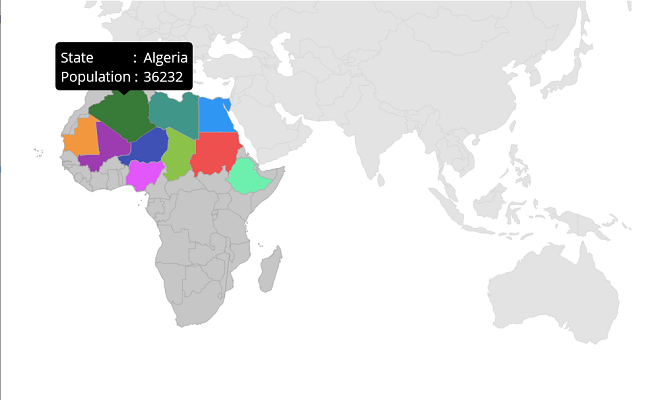
You can enable tooltip for the shape sublayer using the ShowShapeTooltip property.
NOTE
It is applicable for shape layer.
NOTE
Refer to the
Tooltipsection to know more about the tooltip customization.
<map:SfMaps>
    <map:SfMaps.Layer>
        <map:MapShapeLayer ShapesSource = "https://cdn.syncfusion.com/maps/map-data/world-map.json">
            <map:MapShapeLayer.Sublayers>
                <map:MapShapeSublayer ShapesSource = "https://cdn.syncfusion.com/maps/map-data/africa.json"
                                      ShapeStroke = "DarkGrey"
                                      ShapeFill = "#c6c6c6"
                                      ShapeDataField = "name"
                                      DataSource = "{Binding Data}"
                                      PrimaryValuePath = "State"
                                      ShapeColorValuePath = "Color"
                                      ShowShapeTooltip = "True">
                    <map:MapShapeSublayer.ShapeTooltipTemplate>
                        <DataTemplate>
                            <Grid>
                                <Grid.RowDefinitions>
                                    <RowDefinition />
                                    <RowDefinition />
                                </Grid.RowDefinitions>
                                <Grid.ColumnDefinitions>
                                    <ColumnDefinition />
                                    <ColumnDefinition />
                                </Grid.ColumnDefinitions>
                                <Label Text = "State:"
                                       TextColor = "White"
                                       Grid.Row = "0" />
                                <Label Grid.Row = "0"
                                       Grid.Column = "1"
                                       Padding = "5,0,0,0"
                                       Text = "{Binding DataItem.State}"
                                       TextColor = "White" />
                                <Label Text = "Population :"
                                       TextColor = "White"
                                       Grid.Column = "0"
                                       Grid.Row = "1" />
                                <Label Grid.Row = "1"
                                       Grid.Column = "1"
                                       Padding = "5,0,0,0"
                                       Text = "{Binding DataItem.Size}"
                                       TextColor = "White" />
                            </Grid>
                        </DataTemplate>
                    </map:MapShapeSublayer.ShapeTooltipTemplate>
                </map:MapShapeSublayer>
            </map:MapShapeLayer.Sublayers>
            <map:MapShapeLayer.ZoomPanBehavior>
                <map:MapZoomPanBehavior ZoomLevel = "2" />
            </map:MapShapeLayer.ZoomPanBehavior>
        </map:MapShapeLayer>
    </map:SfMaps.Layer>
</map:SfMaps>
public SelectionUG()
{
InitializeComponent();
ViewModel viewModel = new ViewModel();
this.BindingContext = viewModel;
SfMaps maps = new SfMaps();
MapShapeLayer layer = new MapShapeLayer();
layer.ShapesSource = MapSource.FromUri(new Uri("https://cdn.syncfusion.com/maps/map-data/world-map.json"));
MapZoomPanBehavior zoomPanBehavior = new MapZoomPanBehavior();
zoomPanBehavior.ZoomLevel = 2;
layer.ZoomPanBehavior = zoomPanBehavior;
MapShapeSublayer sublayer = new MapShapeSublayer();
sublayer.ShapesSource = MapSource.FromUri(new Uri("https://cdn.syncfusion.com/maps/map-data/africa.json"));
sublayer.ShapeFill = new SolidColorBrush(Color.FromRgb(198, 198, 198));
sublayer.ShapeStroke = new SolidColorBrush(Colors.DarkGray);
sublayer.DataSource = viewModel.Data;
sublayer.PrimaryValuePath = "State";
sublayer.ShapeDataField = "name";
sublayer.ShapeColorValuePath = "Color";
sublayer.ShowShapeTooltip = true;
sublayer.ShapeTooltipTemplate = CreateDataTemplate();
layer.Sublayers.Add(sublayer);
maps.Layer = layer;
this.Content = maps;
}
private DataTemplate CreateDataTemplate()
{
return new DataTemplate(() =>
{
var grid = new Grid()
{
RowDefinitions =
{
new RowDefinition(),
new RowDefinition(),
},
ColumnDefinitions =
{
new ColumnDefinition(),
new ColumnDefinition(),
}
};
var stateLabel = new Label
{
TextColor = Colors.White,
Text = "State",
Padding = 5
};
grid.SetRow(stateLabel, 0); grid.SetColumn(stateLabel, 0);
var stateValue = new Label
{
TextColor = Colors.White,
Padding = 5
};
Binding binding = new Binding();
binding.Source = grid.BindingContext;
binding.Path = nameof(MapTooltipInfo.DataItem) + "." + nameof(Model.State);
stateValue.SetBinding(Label.TextProperty, binding);
grid.SetRow(stateValue, 0); grid.SetColumn(stateValue, 1);
var populationLabel = new Label
{
TextColor = Colors.White,
Text = "Population",
Padding = 5
};
grid.SetRow(populationLabel, 1);
grid.SetColumn(populationLabel, 0);
var populationValue = new Label
{
TextColor = Colors.White,
Padding = 5
};
grid.SetRow(populationValue, 1);
grid.SetColumn(populationValue, 1);
Binding binding1 = new Binding();
binding1.Source = grid.BindingContext;
binding1.Path = nameof(MapTooltipInfo.DataItem) + "." + nameof(Model.Size);
populationValue.SetBinding(Label.TextProperty, binding1);
grid.Add(stateLabel);
grid.Add(stateValue);
grid.Add(populationLabel);
grid.Add(populationValue);
return grid;
});
}
public class ViewModel
{
public ObservableCollection<Model> Data { get; set; }
public ViewModel()
{
Data = new ObservableCollection<Model>();
Data.Add(new Model("Algeria", Color.FromRgb(80, 175, 80), 36232));
Data.Add(new Model("Libya", Color.FromRgb(64, 150, 137), 34121));
Data.Add(new Model("Egypt", Color.FromRgb(48, 150, 243), 43453));
Data.Add(new Model("Mali", Color.FromRgb(157, 59, 176), 28123));
Data.Add(new Model("Niger", Color.FromRgb(63, 81, 181), 40111));
Data.Add(new Model("Nigeria", Color.FromRgb(225, 87, 249), 30232));
Data.Add(new Model("Chad", Color.FromRgb(139, 194, 74), 48132));
Data.Add(new Model("Sudan", Color.FromRgb(238, 79, 79), 52654));
Data.Add(new Model("Mauritania", Color.FromRgb(243, 151, 62), 42231));
Data.Add(new Model("South Sudan", Color.FromRgb(198, 198, 198), 40421));
Data.Add(new Model("Ethiopia", Color.FromRgb(109, 240, 174), 27198));
}
}
public class Model
{
public String State { get; set; }
public Color Color { get; set; }
public double Size { get; set; }
public Model(string state, Color color, double size)
{
State = state;
Color = color;
Size = size;
}
}
Selection
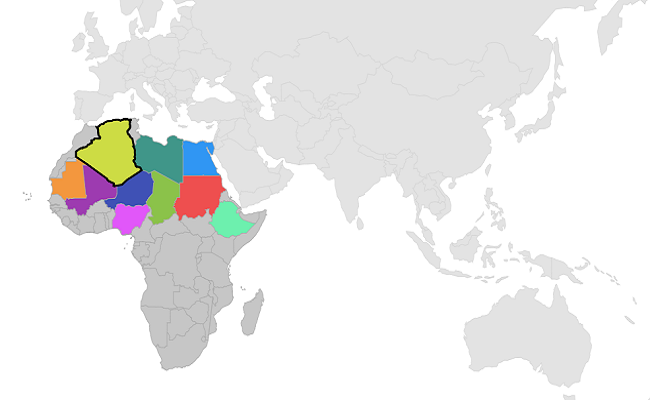
You can enable shape selection on a map using the EnableSelection property. The selection allows you to select only one shape at a time. You can select a shape by tapping it. By default, the selection is disabled.
The ShapeSelected event is used to perform any action on shape selected when the user selects it by tapping, clicking, or programmatically.
NOTE
It is applicable for shape layer.
NOTE
Refer to the
Shape selectionsection to know more about the selection feature.
<map:SfMaps>
    <map:SfMaps.Layer>
        <map:MapShapeLayer ShapesSource = "https://cdn.syncfusion.com/maps/map-data/world-map.json">
            <map:MapShapeLayer.Sublayers>
                <map:MapShapeSublayer ShapesSource = "https://cdn.syncfusion.com/maps/map-data/africa.json"
                                      ShapeStroke = "DarkGrey"
                                      ShapeFill = "#c6c6c6"
                                      ShapeDataField = "name"
                                      DataSource = "{Binding Data}"
                                      PrimaryValuePath = "State"
                                      ShapeColorValuePath = "Color"
                                      EnableSelection = "True"
                                      SelectedShapeFill = "#cddc44"
                                      SelectedShapeStroke = "black"
                                      SelectedShapeStrokeThickness="3">
                </map:MapShapeSublayer>
            </map:MapShapeLayer.Sublayers>
            <map:MapShapeLayer.ZoomPanBehavior>
                <map:MapZoomPanBehavior ZoomLevel = "2" />
            </map:MapShapeLayer.ZoomPanBehavior>
        </map:MapShapeLayer>
    </map:SfMaps.Layer>
</map:SfMaps>
public SelectionUG()
{
InitializeComponent();
ViewModel viewModel = new ViewModel();
this.BindingContext = viewModel;
SfMaps maps = new SfMaps();
MapShapeLayer layer = new MapShapeLayer();
layer.ShapesSource = MapSource.FromUri(new Uri("https://cdn.syncfusion.com/maps/map-data/world-map.json"));
MapZoomPanBehavior zoomPanBehavior = new MapZoomPanBehavior();
zoomPanBehavior.ZoomLevel = 2;
layer.ZoomPanBehavior = zoomPanBehavior;
MapShapeSublayer sublayer = new MapShapeSublayer();
sublayer.ShapesSource = MapSource.FromUri(new Uri("https://cdn.syncfusion.com/maps/map-data/africa.json"));
sublayer.ShapeFill = new SolidColorBrush(Color.FromRgb(198, 198, 198));
sublayer.ShapeStroke = new SolidColorBrush(Colors.DarkGray);
sublayer.DataSource = viewModel.Data;
sublayer.PrimaryValuePath = "State";
sublayer.ShapeDataField = "name";
sublayer.ShapeColorValuePath = "Color";
sublayer.EnableSelection = true;
sublayer.SelectedShapeFill = new SolidColorBrush(Color.FromRgb(205, 220, 68));
sublayer.SelectedShapeStroke = new SolidColorBrush(Colors.Black);
sublayer.SelectedShapeStrokeThickness = 2;
layer.Sublayers.Add(sublayer);
maps.Layer = layer;
this.Content = maps;
}
public class ViewModel
{
public ObservableCollection<Model> Data { get; set; }
public ViewModel()
{
Data = new ObservableCollection<Model>();
Data.Add(new Model("Algeria", Color.FromRgb(80, 175, 80), 36232));
Data.Add(new Model("Libya", Color.FromRgb(64, 150, 137), 34121));
Data.Add(new Model("Egypt", Color.FromRgb(48, 150, 243), 43453));
Data.Add(new Model("Mali", Color.FromRgb(157, 59, 176), 28123));
Data.Add(new Model("Niger", Color.FromRgb(63, 81, 181), 40111));
Data.Add(new Model("Nigeria", Color.FromRgb(225, 87, 249), 30232));
Data.Add(new Model("Chad", Color.FromRgb(139, 194, 74), 48132));
Data.Add(new Model("Sudan", Color.FromRgb(238, 79, 79), 52654));
Data.Add(new Model("Mauritania", Color.FromRgb(243, 151, 62), 42231));
Data.Add(new Model("South Sudan", Color.FromRgb(198, 198, 198), 40421));
Data.Add(new Model("Ethiopia", Color.FromRgb(109, 240, 174), 27198));
}
}
public class Model
{
public String State { get; set; }
public Color Color { get; set; }
public double Size { get; set; }
public Model(string state, Color color, double size)
{
State = state;
Color = color;
Size = size;
}
}
Markers
You can show markers at any position on the map by providing latitude and longitude position to the MapMarker, which is from the Markers collection.
NOTE
It is applicable for both tile layer and shape layer.
NOTE
NOTE
You can refer to our .NET MAUI Maps feature tour page for its groundbreaking feature representations. You can also explore our .NET MAUI Maps Sublayer example that shows how to configure a Maps in .NET MAUI.