Blazor Chart Wizard Appearance
This guide explains how to tailor the appearance of the Chart Wizard component in Blazor. Discover the available properties and see practical examples for each customization option.
Appearance Properties Overview
| Property | Type | Default | Description |
|---|---|---|---|
Width |
string | “100%” | Sets the width of the Chart Wizard (e.g., “800px”, “50%”). |
Height |
string | “100%” | Sets the height of the Chart Wizard (e.g., “600px”, “75%”). |
Theme |
Theme | Material | Sets the visual theme for the component and its sub-components. |
EnableRtl |
bool | false | Enables right-to-left layout for RTL languages. |
PropertyPanelExpanded |
bool | true | Shows or hides the property panel on initial render. |
Width and Height
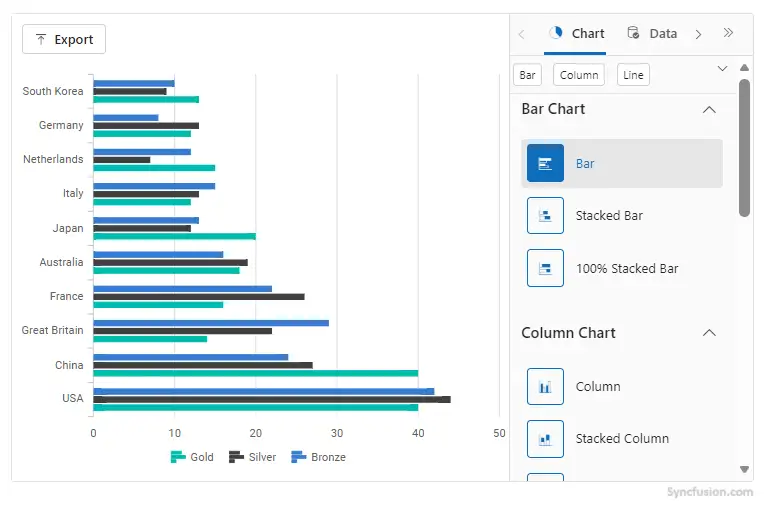
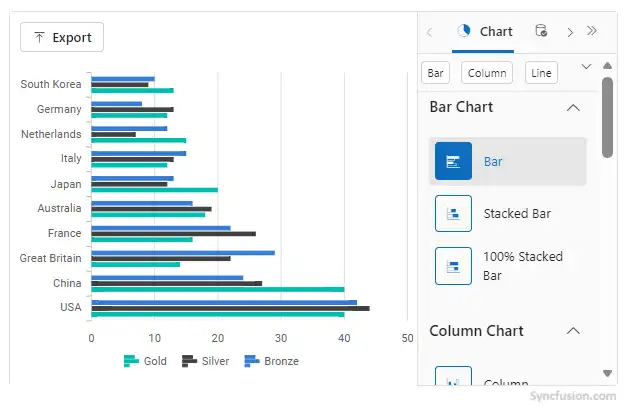
You can control the size of the Chart Wizard by specifying the Width and Height properties. Use pixel values for fixed sizing or percentages for responsive layouts.
In percentage
<div class="control-section">
    <SfChartWizard Width="60%" Height="">
        <ChartSettings DataSource="@OlympicsDataSource"
                       CategoryFields="@categories"
                       SeriesType="ChartWizardSeriesType.Bar"
                       SeriesFields="@chartSeries">
        </ChartSettings>
    </SfChartWizard>
</div>

@code {
    private readonly List<string> chartSeries = new() { "Gold", "Silver", "Bronze" };
    private readonly List<string> categories = new() { "Country", "CountryCode" };

    public class OlympicsData
    {
        public string? Country { get; set; }
        public string? CountryCode { get; set; }
        public int Gold { get; set; }
        public int Silver { get; set; }
        public int Bronze { get; set; }
    }

    private readonly List<OlympicsData> OlympicsDataSource = new()
    {
        new OlympicsData { Country = "USA", CountryCode = "USA", Gold = 40, Silver = 44, Bronze = 42 },
        new OlympicsData { Country = "China", CountryCode = "CHN", Gold = 40, Silver = 27, Bronze = 24 },
        new OlympicsData { Country = "Great Britain", CountryCode = "GBR", Gold = 14, Silver = 22, Bronze = 29 },
        new OlympicsData { Country = "France", CountryCode = "FRA", Gold = 16, Silver = 26, Bronze = 22 },
        new OlympicsData { Country = "Australia", CountryCode = "AUS", Gold = 18, Silver = 19, Bronze = 16 },
        new OlympicsData { Country = "Japan", CountryCode = "JPN", Gold = 20, Silver = 12, Bronze = 13 },
        new OlympicsData { Country = "Italy", CountryCode = "ITA", Gold = 12, Silver = 13, Bronze = 15 },
        new OlympicsData { Country = "Netherlands", CountryCode = "NLD", Gold = 15, Silver = 7,  Bronze = 12 },
        new OlympicsData { Country = "Germany", CountryCode = "DEU", Gold = 12, Silver = 13, Bronze = 8  },
        new OlympicsData { Country = "South Korea", CountryCode = "KOR", Gold = 13, Silver = 9,  Bronze = 10 }
    };
}
In pixel
<div class="control-section">
    <SfChartWizard Width="650px" Height="400px">
        <ChartSettings DataSource="@OlympicsDataSource"
                       CategoryFields="@categories"
                       SeriesType="ChartWizardSeriesType.Bar"
                       SeriesFields="@chartSeries">
        </ChartSettings>
    </SfChartWizard>
</div>

@code {
    private readonly List<string> chartSeries = new() { "Gold", "Silver", "Bronze" };
    private readonly List<string> categories = new() { "Country", "CountryCode" };

    public class OlympicsData
    {
        public string? Country { get; set; }
        public string? CountryCode { get; set; }
        public int Gold { get; set; }
        public int Silver { get; set; }
        public int Bronze { get; set; }
    }

    private readonly List<OlympicsData> OlympicsDataSource = new()
    {
        new OlympicsData { Country = "USA", CountryCode = "USA", Gold = 40, Silver = 44, Bronze = 42 },
        new OlympicsData { Country = "China", CountryCode = "CHN", Gold = 40, Silver = 27, Bronze = 24 },
        new OlympicsData { Country = "Great Britain", CountryCode = "GBR", Gold = 14, Silver = 22, Bronze = 29 },
        new OlympicsData { Country = "France", CountryCode = "FRA", Gold = 16, Silver = 26, Bronze = 22 },
        new OlympicsData { Country = "Australia", CountryCode = "AUS", Gold = 18, Silver = 19, Bronze = 16 },
        new OlympicsData { Country = "Japan", CountryCode = "JPN", Gold = 20, Silver = 12, Bronze = 13 },
        new OlympicsData { Country = "Italy", CountryCode = "ITA", Gold = 12, Silver = 13, Bronze = 15 },
        new OlympicsData { Country = "Netherlands", CountryCode = "NLD", Gold = 15, Silver = 7,  Bronze = 12 },
        new OlympicsData { Country = "Germany", CountryCode = "DEU", Gold = 12, Silver = 13, Bronze = 8  },
        new OlympicsData { Country = "South Korea", CountryCode = "KOR", Gold = 13, Silver = 9,  Bronze = 10 }
    };
}
Theme
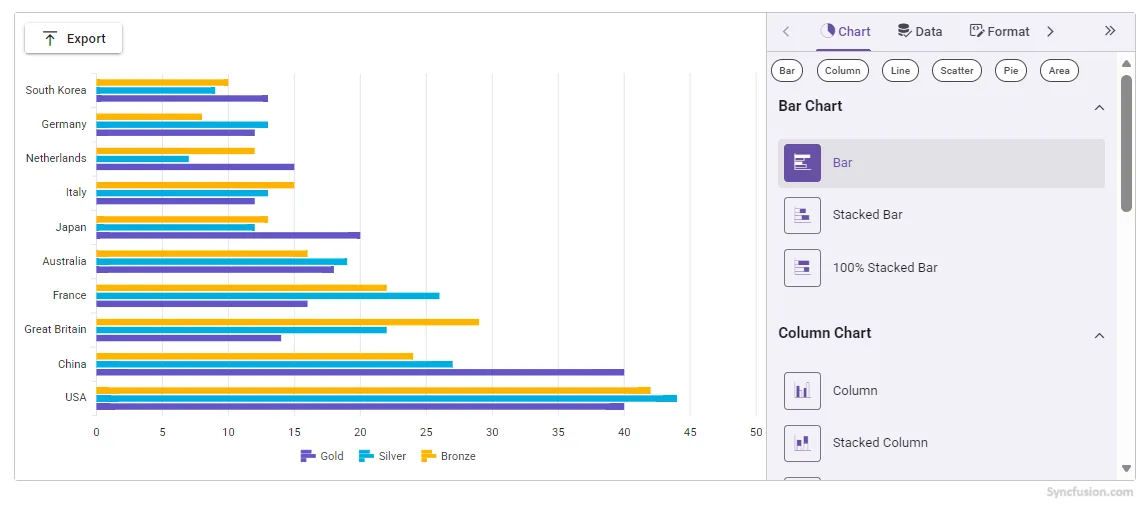
The Theme property applies a built-in visual style to the chart. Choose from available themes to match the application’s look and feel.
<div class="control-section">
    <SfChartWizard Theme="Theme.Material3">
        <ChartSettings DataSource="@OlympicsDataSource"
                       CategoryFields="@categories"
                       SeriesType="ChartWizardSeriesType.Bar"
                       SeriesFields="@chartSeries">
        </ChartSettings>
    </SfChartWizard>
</div>

@code {
    private readonly List<string> chartSeries = new() { "Gold", "Silver", "Bronze" };
    private readonly List<string> categories = new() { "Country", "CountryCode" };

    public class OlympicsData
    {
        public string? Country { get; set; }
        public string? CountryCode { get; set; }
        public int Gold { get; set; }
        public int Silver { get; set; }
        public int Bronze { get; set; }
    }

    private readonly List<OlympicsData> OlympicsDataSource = new()
    {
        new OlympicsData { Country = "USA", CountryCode = "USA", Gold = 40, Silver = 44, Bronze = 42 },
        new OlympicsData { Country = "China", CountryCode = "CHN", Gold = 40, Silver = 27, Bronze = 24 },
        new OlympicsData { Country = "Great Britain", CountryCode = "GBR", Gold = 14, Silver = 22, Bronze = 29 },
        new OlympicsData { Country = "France", CountryCode = "FRA", Gold = 16, Silver = 26, Bronze = 22 },
        new OlympicsData { Country = "Australia", CountryCode = "AUS", Gold = 18, Silver = 19, Bronze = 16 },
        new OlympicsData { Country = "Japan", CountryCode = "JPN", Gold = 20, Silver = 12, Bronze = 13 },
        new OlympicsData { Country = "Italy", CountryCode = "ITA", Gold = 12, Silver = 13, Bronze = 15 },
        new OlympicsData { Country = "Netherlands", CountryCode = "NLD", Gold = 15, Silver = 7,  Bronze = 12 },
        new OlympicsData { Country = "Germany", CountryCode = "DEU", Gold = 12, Silver = 13, Bronze = 8  },
        new OlympicsData { Country = "South Korea", CountryCode = "KOR", Gold = 13, Silver = 9,  Bronze = 10 }
    };
}
NOTE
The
Themeproperty applies the selected theme to the chart area, not the entire Chart Wizard UI. For a consistent look across the whole component, refer to the theme section in Getting started.
EnableRtl
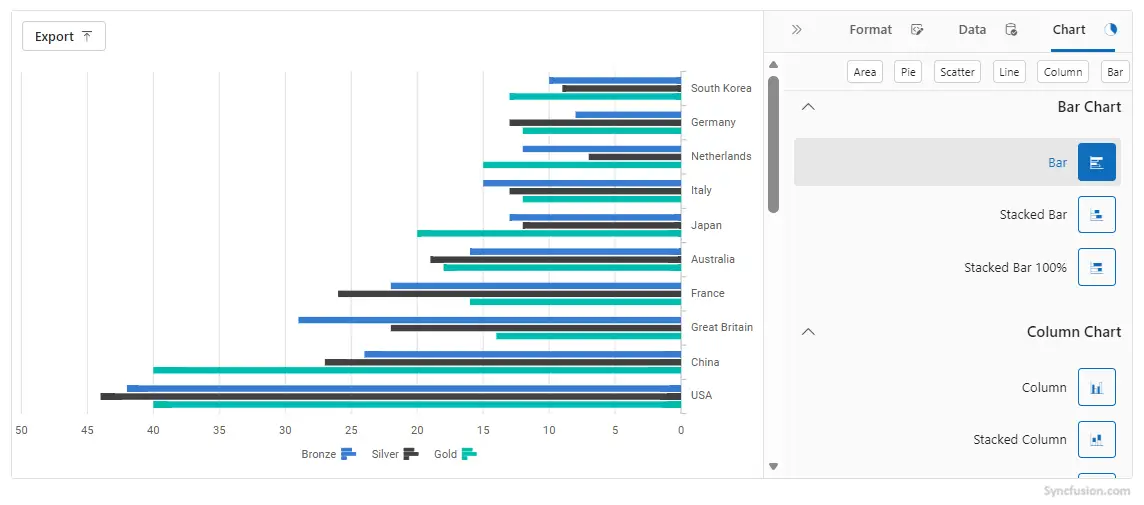
Set EnableRtl to true to support right-to-left languages such as Arabic or Hebrew. This option automatically adjusts the alignment of headers, panels, and controls for RTL layouts.
<div class="control-section">
    <SfChartWizard EnableRtl="true">
        <ChartSettings DataSource="@OlympicsDataSource"
                       CategoryFields="@categories"
                       SeriesType="ChartWizardSeriesType.Bar"
                       SeriesFields="@chartSeries">
        </ChartSettings>
    </SfChartWizard>
</div>

@code {
    private readonly List<string> chartSeries = new() { "Gold", "Silver", "Bronze" };
    private readonly List<string> categories = new() { "Country", "CountryCode" };

    public class OlympicsData
    {
        public string? Country { get; set; }
        public string? CountryCode { get; set; }
        public int Gold { get; set; }
        public int Silver { get; set; }
        public int Bronze { get; set; }
    }

    private readonly List<OlympicsData> OlympicsDataSource = new()
    {
        new OlympicsData { Country = "USA", CountryCode = "USA", Gold = 40, Silver = 44, Bronze = 42 },
        new OlympicsData { Country = "China", CountryCode = "CHN", Gold = 40, Silver = 27, Bronze = 24 },
        new OlympicsData { Country = "Great Britain", CountryCode = "GBR", Gold = 14, Silver = 22, Bronze = 29 },
        new OlympicsData { Country = "France", CountryCode = "FRA", Gold = 16, Silver = 26, Bronze = 22 },
        new OlympicsData { Country = "Australia", CountryCode = "AUS", Gold = 18, Silver = 19, Bronze = 16 },
        new OlympicsData { Country = "Japan", CountryCode = "JPN", Gold = 20, Silver = 12, Bronze = 13 },
        new OlympicsData { Country = "Italy", CountryCode = "ITA", Gold = 12, Silver = 13, Bronze = 15 },
        new OlympicsData { Country = "Netherlands", CountryCode = "NLD", Gold = 15, Silver = 7,  Bronze = 12 },
        new OlympicsData { Country = "Germany", CountryCode = "DEU", Gold = 12, Silver = 13, Bronze = 8  },
        new OlympicsData { Country = "South Korea", CountryCode = "KOR", Gold = 13, Silver = 9,  Bronze = 10 }
    };
}
PropertyPanelExpanded
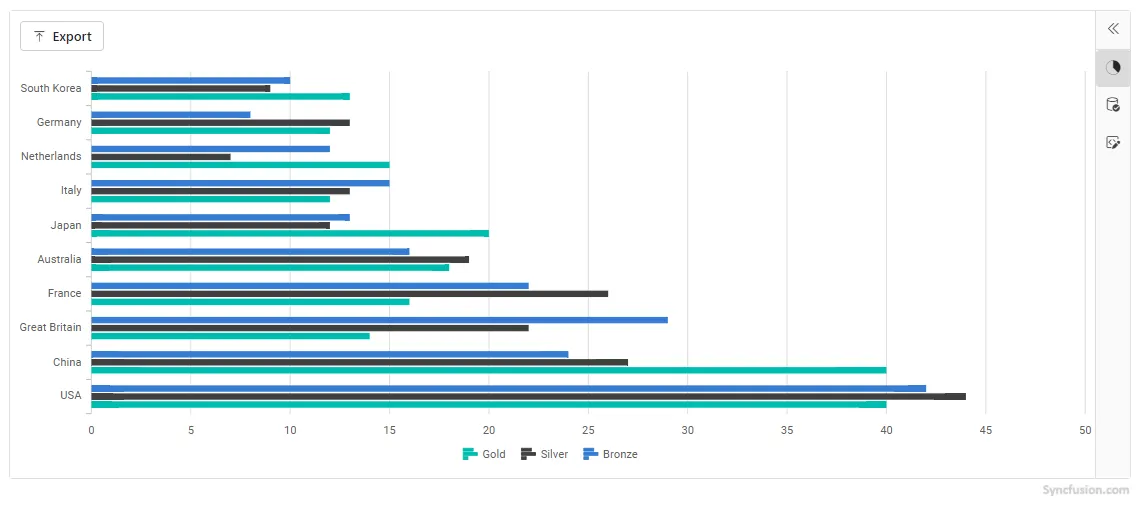
The PropertyPanelExpanded property controls whether the property panel is open when the Chart Wizard first loads. Set it to false to start with the panel collapsed, giving more space to the chart area.
<div class="control-section">
    <SfChartWizard PropertyPanelExpanded="false">
        <ChartSettings DataSource="@OlympicsDataSource"
                       CategoryFields="@categories"
                       SeriesType="ChartWizardSeriesType.Bar"
                       SeriesFields="@chartSeries">
        </ChartSettings>
    </SfChartWizard>
</div>

@code {
    private readonly List<string> chartSeries = new() { "Gold", "Silver", "Bronze" };
    private readonly List<string> categories = new() { "Country", "CountryCode" };

    public class OlympicsData
    {
        public string? Country { get; set; }
        public string? CountryCode { get; set; }
        public int Gold { get; set; }
        public int Silver { get; set; }
        public int Bronze { get; set; }
    }

    private readonly List<OlympicsData> OlympicsDataSource = new()
    {
        new OlympicsData { Country = "USA", CountryCode = "USA", Gold = 40, Silver = 44, Bronze = 42 },
        new OlympicsData { Country = "China", CountryCode = "CHN", Gold = 40, Silver = 27, Bronze = 24 },
        new OlympicsData { Country = "Great Britain", CountryCode = "GBR", Gold = 14, Silver = 22, Bronze = 29 },
        new OlympicsData { Country = "France", CountryCode = "FRA", Gold = 16, Silver = 26, Bronze = 22 },
        new OlympicsData { Country = "Australia", CountryCode = "AUS", Gold = 18, Silver = 19, Bronze = 16 },
        new OlympicsData { Country = "Japan", CountryCode = "JPN", Gold = 20, Silver = 12, Bronze = 13 },
        new OlympicsData { Country = "Italy", CountryCode = "ITA", Gold = 12, Silver = 13, Bronze = 15 },
        new OlympicsData { Country = "Netherlands", CountryCode = "NLD", Gold = 15, Silver = 7,  Bronze = 12 },
        new OlympicsData { Country = "Germany", CountryCode = "DEU", Gold = 12, Silver = 13, Bronze = 8  },
        new OlympicsData { Country = "South Korea", CountryCode = "KOR", Gold = 13, Silver = 9,  Bronze = 10 }
    };
}
See Also
- Explore the Chart Wizard Demo for interactive samples.