Selection in WinUI Chart
24 May 20229 minutes to read
SfChart supports selection that allows you to select a segment in a series or the series itself by using ChartSelectionBehavior.
Enable selection
To enable selection, create an instance of ChartSelectionBehavior and add it to the Behaviors collection.
<syncfusion:SfChart.Behaviors>

<syncfusion:ChartSelectionBehavior >

</syncfusion:ChartSelectionBehavior>

</syncfusion:SfChart.Behaviors>
ChartSelectionBehavior selection = new ChartSelectionBehavior();
chart.Behaviors.Add(selection);Segment Selection
Segment selection allows you to highlight a segment in a chart series. For highlighting a segment, the brush color can be set using the SelectionBrush property.
Segment Selection in ColumnSeries
<chart:SChart>
. . .
<chart:SfChart.Behaviors>
<chart:ChartSelectionBehavior />
</chart:SfChart.Behaviors>
<chart:ColumnSeries ItemsSource="{Binding Data}"
XBindingPath="Demand"
YBindingPath="Year2010"
SelectionBrush="Green"/>
</chart:SfChart>SChart chart = new SChart();
. . .
ChartSelectionBehavior selection = new ChartSelectionBehavior();

chart.Behaviors.Add(selection);
ColumnSeries series = new ColumnSeries()
{
ItemsSource = new ViewModel().Data,
XBindingPath = "Demand",
YBindingPath = "Year2010",
SelectionBrush = new SolidColorBrush(Colors.Green)
};
chart.Series.Add(series);
this.Content = chart;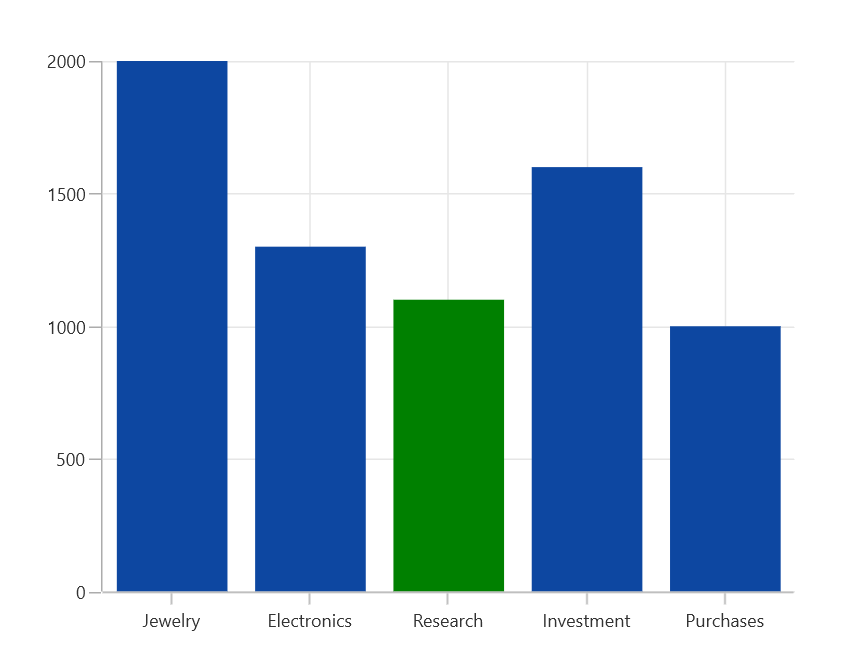
Segment Selection in Linear Series
In linear type series, the segment selection can be viewed by changing the data label interior.
The following code example demonstrates the spline series segment selection by changing the data label interior.
<chart:SfChart>
. . .
    <chart:SfChart.Behaviors>
        <chart:ChartSelectionBehavior />
    </chart:SfChart.Behaviors>

    <chart:SplineSeries ItemsSource="{Binding Data}"
                        XBindingPath="Demand"
                        YBindingPath="Year2010"
                        SelectionBrush="Green"
                        ShowDataLabels="True"/>
</chart:SfChart>
SfChart chart = new SfChart();
. . .
ChartSelectionBehavior selection = new ChartSelectionBehavior();
chart.Behaviors.Add(selection);
SplineSeries series = new SplineSeries()
{
ItemsSource = new ViewModel().Data,
XBindingPath = "Demand",
YBindingPath = "Year2010",
SelectionBrush = new SolidColorBrush(Colors.Green),
ShowDataLabels="True"
};
chart.Series.Add(series);
this.Content = chart;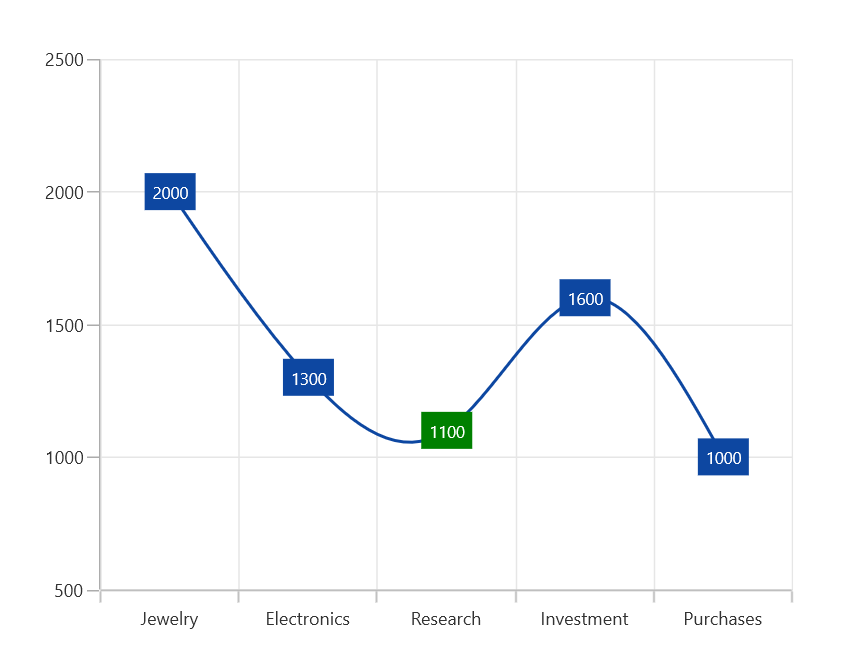
Series Selection
Series selection is used when there are multiple series and you want to highlight one of them. Series selection can be enabled by setting the Type property value to Series in ChartSelectionBehavior. The SeriesSelectionBrush property is used to set the brush color to highlight the series.
The following code example demonstrates highlighting a series.
<chart:SfChart>
. . .
    <chart:SfChart.Behaviors>
        <chart:ChartSelectionBehavior SeriesSelectionBrush="Green" Type="Series"/>
    </chart:SfChart.Behaviors>
. . .
</chart:SfChart>
SfChart chart = new SfChart();
. . .
ChartSelectionBehavior selection = new ChartSelectionBehavior();
selection.SeriesSelectionBrush = new SolidColorBrush(Colors.Green);
selection.Type = SelectionType.Series;
chart.Behaviors.Add(selection);
. . .
this.Content = chart;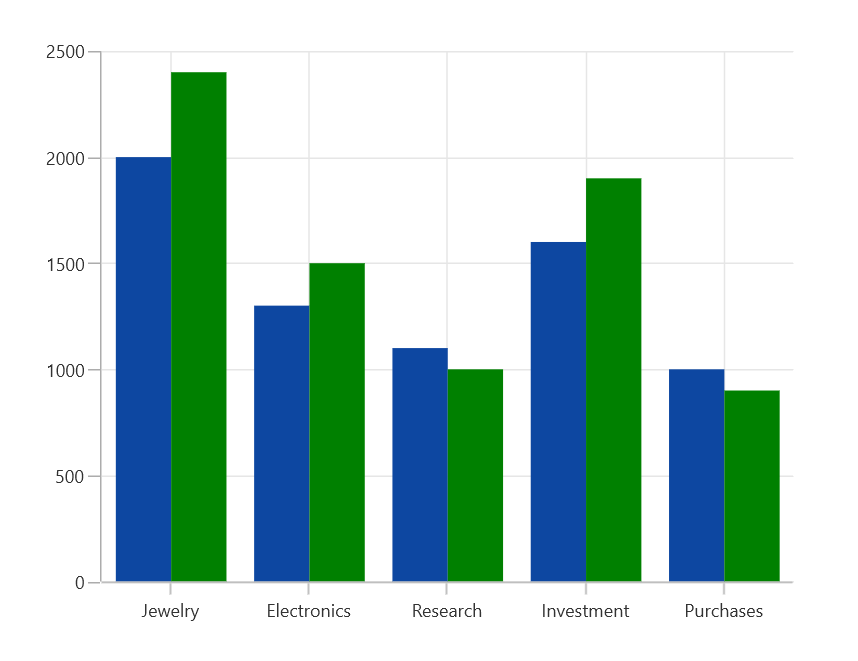
Customizing the Selection
SfChart allows you to select single or multiple segment\series using the Type property. By default, the Type value is Point. The MultiPoint and MultiSeries values of Type property is used to select multiple segments and series respectively.
The following code sample demonstrates how to select multiple segments.
<chart:SfChart>
. . .
    <chart:SfChart.Behaviors>
        <chart:ChartSelectionBehavior Type="MultiPoint"/>
    </chart:SfChart.Behaviors>

    <chart:SfChart.Series>
        <chart:ColumnSeries ItemsSource="{Binding Data}"
                            XBindingPath="Demand"
                            YBindingPath="Year2010"
                            SelectionBrush="Green"/>
    </chart:SfChart.Series>

</chart:SfChart>
SfChart chart = new SfChart();
. . .
ChartSelectionBehavior selection = new ChartSelectionBehavior();
selection.Type = SelectionType.MultiPoint;
chart.Behaviors.Add(selection);
ColumnSeries series = new ColumnSeries()
{
ItemsSource = new ViewModel().Data,
XBindingPath = "Demand",
YBindingPath = "Year2010",
SelectionBrush = new SolidColorBrush(Colors.Green)
};
chart.Series.Add(series);
this.Content = chart;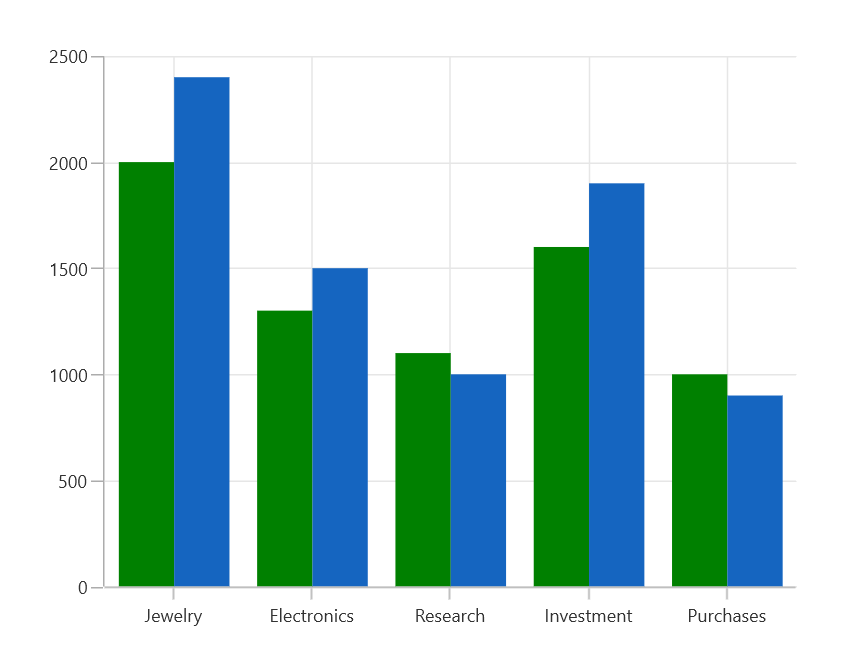
Changing cursor while selection
The Cursor property allows you to define the cursor when mouse is hovered over the segment with segment selection enabled.
<chart:SfChart>
. . .
    <chart:SfChart.Behaviors>
        <chart:ChartSelectionBehavior Cursor="Hand"/>
    </chart:SfChart.Behaviors>

    <chart:SfChart.Series>
        <chart:ColumnSeries ItemsSource="{Binding Data}"
                            XBindingPath="Demand"
                            YBindingPath="Year2010"
                            SelectionBrush="Green"/>
     </chart:SfChart.Series>

</chart:SfChart>
SfChart chart = new SfChart();
. . .
ChartSelectionBehavior selection = new ChartSelectionBehavior();
selection.Cursor = Windows.UI.Core.CoreCursorType.Hand;
chart.Behaviors.Add(selection);
ColumnSeries series = new ColumnSeries()
{
ItemsSource = new ViewModel().Data,
XBindingPath = "Demand",
YBindingPath = "Year2010",
SelectionBrush = new SolidColorBrush(Colors.Green)
};
chart.Series.Add(series);
this.Content = chart;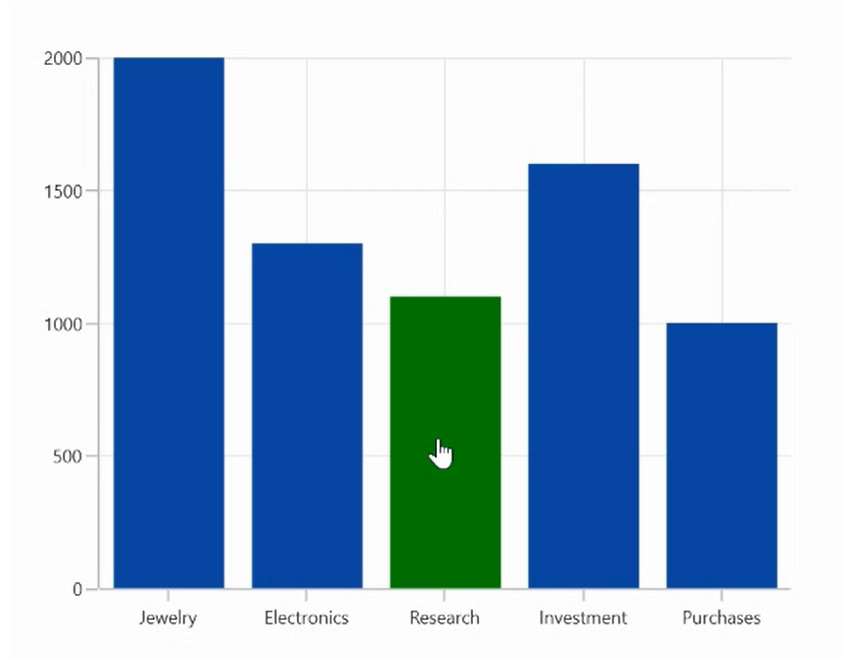
Events
The following events are available in SfChart for ChartSelectionBehavior.
SelectionChanging
The SelectionChanging event occurs before the data point is being selected. This is a cancelable event. This argument contains the following information:
-
SelectedSeries- Gets the series of the selected data point. -
SelectedSegments- Gets or sets the segments collection of the selected series. -
SelectedSegment- Gets the segment of the selected data point. -
SelectedIndex- Gets the selected data point index. -
PreviousSelectedIndex- Gets the previous selected data point index. -
IsSelected- Gets a value that indicates whether the segment or series is selected. -
IsDataPointSelection- Gets a value that indicates whether the selection is segment selection or series selection. -
Cancel- Gets or sets a value that indicates whether the selection should be canceled or not.
SelectionChanged
The SelectionChanged event occurs after a data point has been selected. This argument contains the following information:
-
SelectedSeries- Gets the series of the selected data point. -
SelectedSegments- Gets the segments collection of the selected series. -
SelectedSegment- Gets the segment of the selected data point. -
SelectedIndex- Gets the selected data point index. -
PreviousSelectedSeries- Gets the previous selected series. -
PreviousSelectedSegments- Gets the segments collection of previous selected series. -
PreviousSelectedSegment- Gets the segment of previous selected data point. -
PreviousSelectedIndex- Gets the previous selected data point index. -
OldPointInfo- Gets the previous selected segment item value. -
NewPointInfo- Gets the selected segment item value. -
IsSelected- Gets a value that indicates whether the segment or series is being selected. -
IsDataPointSelection- Gets a value that indicates whether the selection is segment selection or series selection. -
SelectedSeriesCollection- Gets the series collection that has been selected using rectangle selection or mouse interaction.