OHLC Chart in WinUI Chart
10 Jul 20268 minutes to read
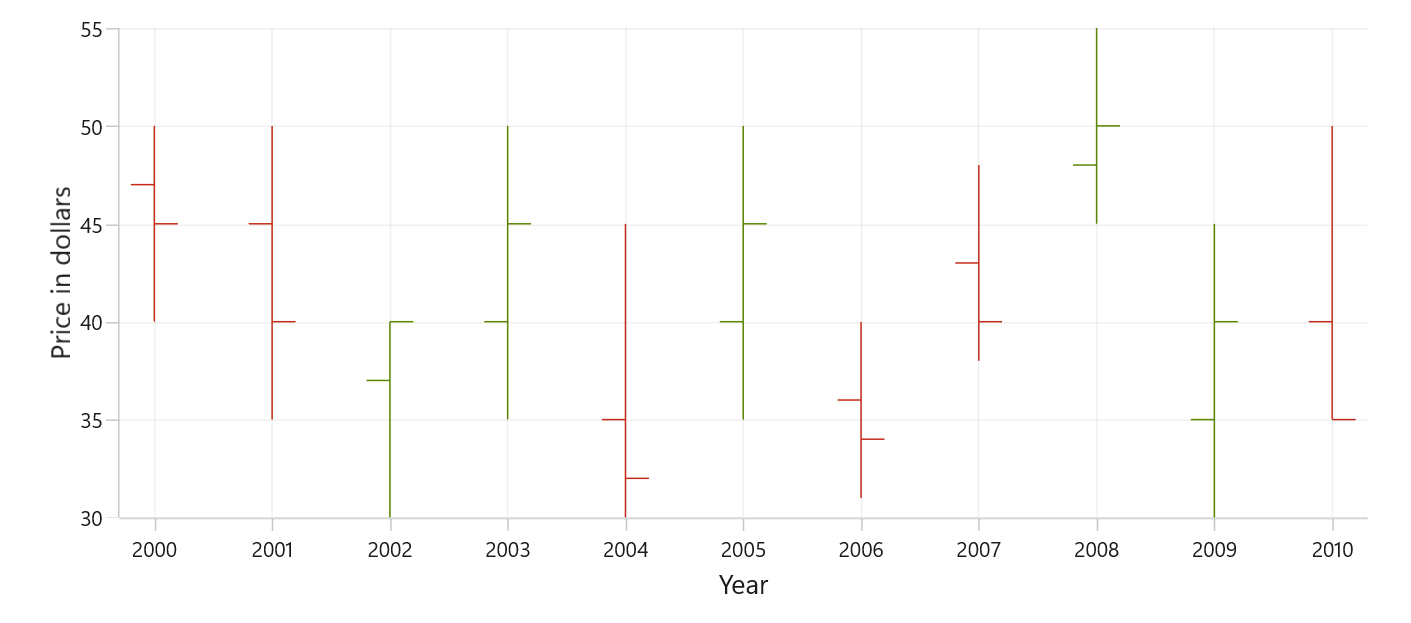
OHLC (Open-High-Low-Close) charts are a type of financial chart used to represent the price movement of an asset over a specific period. OHLC charts consist of four data points: the opening price, the high price, the low price, and the closing price for each period. To render an OHLC chart, create an instance of HiLoOpenCloseSeries, and add it to the Series collection property of SfCartesianChart.
To plot a point on an OHLC chart, a collection of five values is required, including the X-value, open value, high value, low value, and close value. You can use the below collection.
public ObservableCollection<Model> StockData { get; set; } = new ObservableCollection<Model>();
StockData.Add(new Model { Year = "2000", High = 50, Low = 40, Open = 47, Close = 45 });
StockData.Add(new Model { Year = "2001", High = 50, Low = 35, Open = 45, Close = 40 });
StockData.Add(new Model { Year = "2002", High = 40, Low = 30, Open = 37, Close = 40 });
StockData.Add(new Model { Year = "2003", High = 50, Low = 35, Open = 40, Close = 45 });
StockData.Add(new Model { Year = "2004", High = 45, Low = 30, Open = 35, Close = 32 });
StockData.Add(new Model { Year = "2005", High = 50, Low = 35, Open = 40, Close = 45 });
StockData.Add(new Model { Year = "2006", High = 40, Low = 31, Open = 36, Close = 34 });
StockData.Add(new Model { Year = "2007", High = 48, Low = 38, Open = 43, Close = 40 });
StockData.Add(new Model { Year = "2008", High = 55, Low = 45, Open = 48, Close = 50 });
StockData.Add(new Model { Year = "2009", High = 45, Low = 30, Open = 35, Close = 40 });
StockData.Add(new Model { Year = "2010", High = 50, Low = 40, Open = 40, Close = 35 });
Set ItemsSource to your data collection and map XBindingPath and Open/High/Low/Close.
<chart:SfCartesianChart>
    <chart:SfCartesianChart.XAxes>
        <chart:CategoryAxis/>
    </chart:SfCartesianChart.XAxes>

    <chart:SfCartesianChart.YAxes>
        <chart:NumericalAxis/>
    </chart:SfCartesianChart.YAxes>

    <chart:HiLoOpenCloseSeries
        ItemsSource="{Binding StockData}"
        XBindingPath="Year"
        Open="Open"
        High="High"
        Low="Low"
        Close="Close"/>
</chart:SfCartesianChart>
SfCartesianChart chart = new SfCartesianChart();
CategoryAxis primaryAxis = new CategoryAxis();
chart.XAxes.Add(primaryAxis);
NumericalAxis secondaryAxis = new NumericalAxis();
chart.YAxes.Add(secondaryAxis);
var series = new HiLoOpenCloseSeries()
{
ItemsSource = new ViewModel().StockData,
XBindingPath = "Year",
Open = "Open",
High = "High",
Low = "Low",
Close = "Close",
};
chart.Series.Add(series);
this.Content = chart;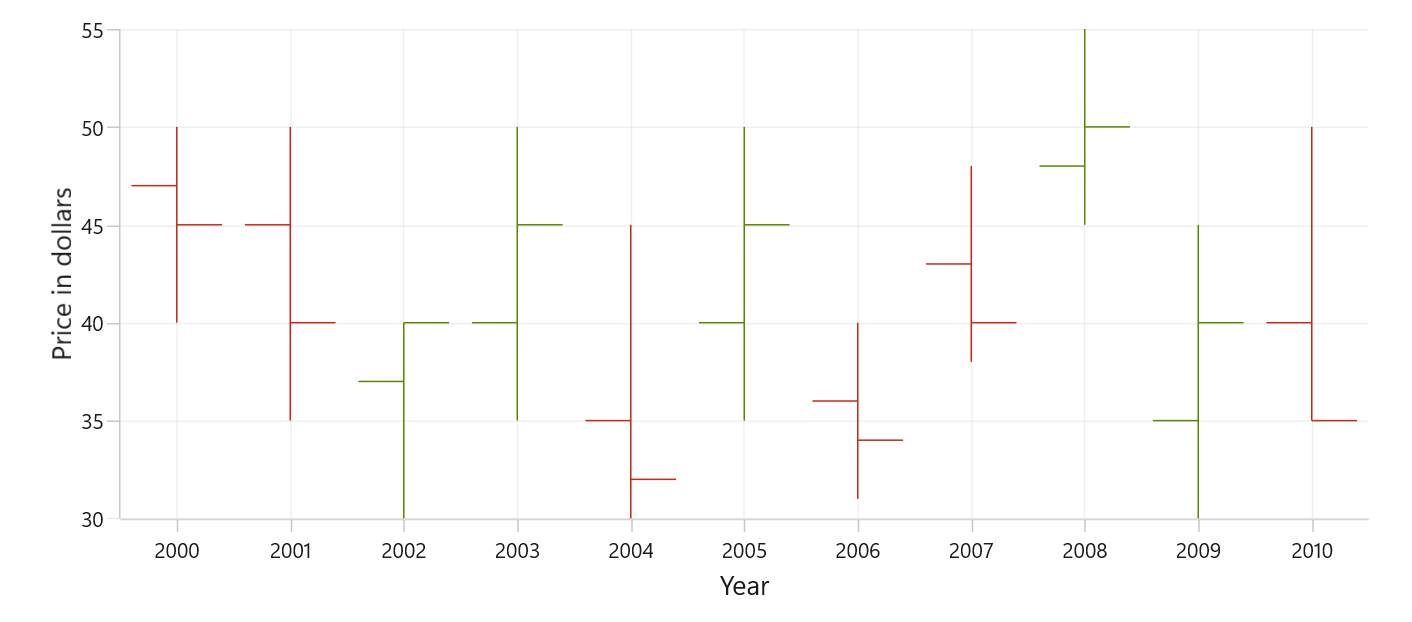
Bull and Bear Color
Use BullishBrush to set the brush for OHLC segments where the close is equal to or higher than the open (bullish/increasing periods), and BearishBrush for segments where the close is lower than the open (bearish/decreasing periods). If not specified, the series falls back to its default brush.
<chart:SfCartesianChart>
    <chart:SfCartesianChart.XAxes>
        <chart:CategoryAxis/>
    </chart:SfCartesianChart.XAxes>

    <chart:SfCartesianChart.YAxes>
        <chart:NumericalAxis/>
    </chart:SfCartesianChart.YAxes>

    <chart:HiLoOpenCloseSeries
        ItemsSource="{Binding StockData}"
        XBindingPath="Year"
        Open="Open"
        High="High"
        Low="Low"
        Close="Close"
        BullishBrush="Blue"
        BearishBrush="Orange"/>
</chart:SfCartesianChart>
SfCartesianChart chart = new SfCartesianChart();
CategoryAxis primaryAxis = new CategoryAxis();
chart.XAxes.Add(primaryAxis);
NumericalAxis secondaryAxis = new NumericalAxis();
chart.YAxes.Add(secondaryAxis);
var series = new HiLoOpenCloseSeries()
{
ItemsSource = new ViewModel().StockData,
XBindingPath = "Year",
Open = "Open",
High = "High",
Low = "Low",
Close = "Close",
BullishBrush = new SolidColorBrush(Colors.Blue),
BearishBrush = new SolidColorBrush(Colors.Orange),
};
chart.Series.Add(series);
this.Content = chart;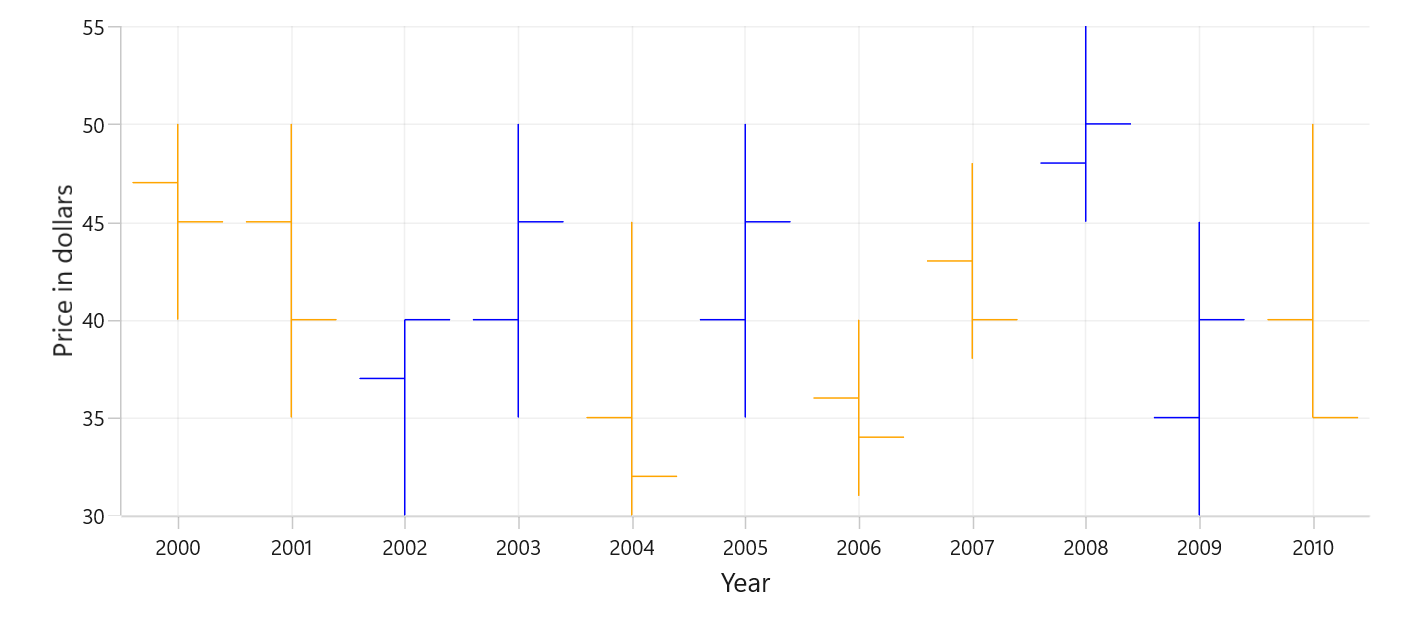
Segment Width
The SegmentWidth property sets the width of each data point (segment) in the series. It accepts values between 0 and 1, the default is 0.8. A value of 1.0 makes the segment occupy the full category width, while smaller values make the segment narrower.
<chart:SfCartesianChart>
    <chart:SfCartesianChart.XAxes>
        <chart:CategoryAxis/>
    </chart:SfCartesianChart.XAxes>

    <chart:SfCartesianChart.YAxes>
        <chart:NumericalAxis/>
    </chart:SfCartesianChart.YAxes>

    <chart:HiLoOpenCloseSeries
        ItemsSource="{Binding StockData}"
        XBindingPath="Year"
        Open="Open"
        High="High"
        Low="Low"
        Close="Close"
        SegmentWidth="0.4"/>
</chart:SfCartesianChart>
SfCartesianChart chart = new SfCartesianChart();
CategoryAxis primaryAxis = new CategoryAxis();
chart.XAxes.Add(primaryAxis);
NumericalAxis secondaryAxis = new NumericalAxis();
chart.YAxes.Add(secondaryAxis);
var series = new HiLoOpenCloseSeries()
{
ItemsSource = new ViewModel().StockData,
XBindingPath = "Year",
Open = "Open",
High = "High",
Low = "Low",
Close = "Close",
SegmentWidth = 0.4
};
chart.Series.Add(series);
this.Content = chart;