Candle Chart in WinUI Chart
10 Jul 202611 minutes to read
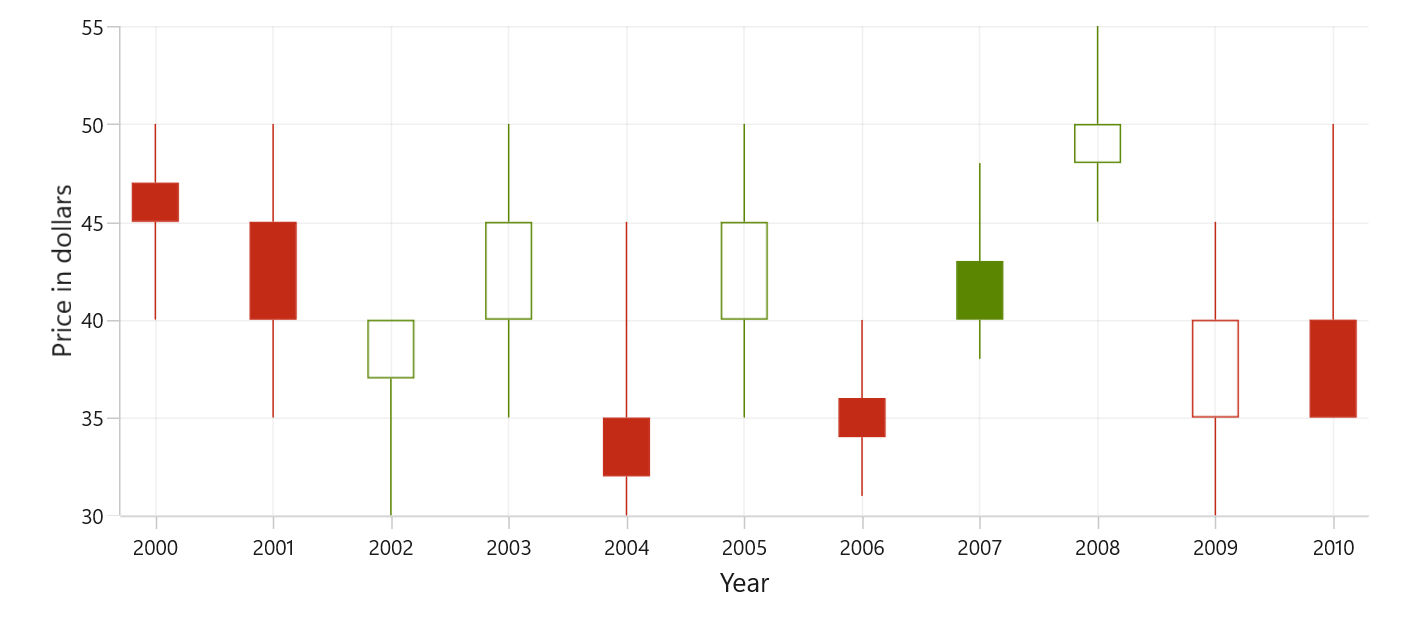
Candle charts are a type of financial chart used to represent the price movement of an asset over time. The chart is made up of a series of rectangular bars, called candlesticks, that represent a specific time, typically one day. To render a candle chart, create an instance of CandleSeries, and add it to the Series collection property of SfCartesianChart.
To plot a point on a candlestick chart, a collection of five values is required, including the X-value, open value, high value, low value, and close value. You can use the below collection.
public ObservableCollection<Model> StockData { get; set; } = new ObservableCollection<Model>();
StockData.Add(new Model { Year = "2000", High = 50, Low = 40, Open = 47, Close = 45 });
StockData.Add(new Model { Year = "2001", High = 50, Low = 35, Open = 45, Close = 40 });
StockData.Add(new Model { Year = "2002", High = 40, Low = 30, Open = 37, Close = 40 });
StockData.Add(new Model { Year = "2003", High = 50, Low = 35, Open = 40, Close = 45 });
StockData.Add(new Model { Year = "2004", High = 45, Low = 30, Open = 35, Close = 32 });
StockData.Add(new Model { Year = "2005", High = 50, Low = 35, Open = 40, Close = 45 });
StockData.Add(new Model { Year = "2006", High = 40, Low = 31, Open = 36, Close = 34 });
StockData.Add(new Model { Year = "2007", High = 48, Low = 38, Open = 43, Close = 40 });
StockData.Add(new Model { Year = "2008", High = 55, Low = 45, Open = 48, Close = 50 });
StockData.Add(new Model { Year = "2009", High = 45, Low = 30, Open = 35, Close = 40 });
StockData.Add(new Model { Year = "2010", High = 50, Low = 40, Open = 40, Close = 35 });
Set ItemsSource to your data collection and map XBindingPath and Open/High/Low/Close.
<chart:SfCartesianChart>
    <chart:SfCartesianChart.XAxes>
        <chart:CategoryAxis/>
    </chart:SfCartesianChart.XAxes>

    <chart:SfCartesianChart.YAxes>
        <chart:NumericalAxis/>
    </chart:SfCartesianChart.YAxes>

    <chart:CandleSeries
        ItemsSource="{Binding StockData}"
        XBindingPath="Year"
        Open="Open"
        High="High"
        Low="Low"
        Close="Close"/>
</chart:SfCartesianChart>
SfCartesianChart chart = new SfCartesianChart();
CategoryAxis primaryAxis = new CategoryAxis();
chart.XAxes.Add(primaryAxis);
NumericalAxis secondaryAxis = new NumericalAxis();
chart.YAxes.Add(secondaryAxis);
var series = new CandleSeries()
{
ItemsSource = new ViewModel().StockData,
XBindingPath = "Year",
Open = "Open",
High = "High",
Low = "Low",
Close = "Close",
};
chart.Series.Add(series);
this.Content = chart;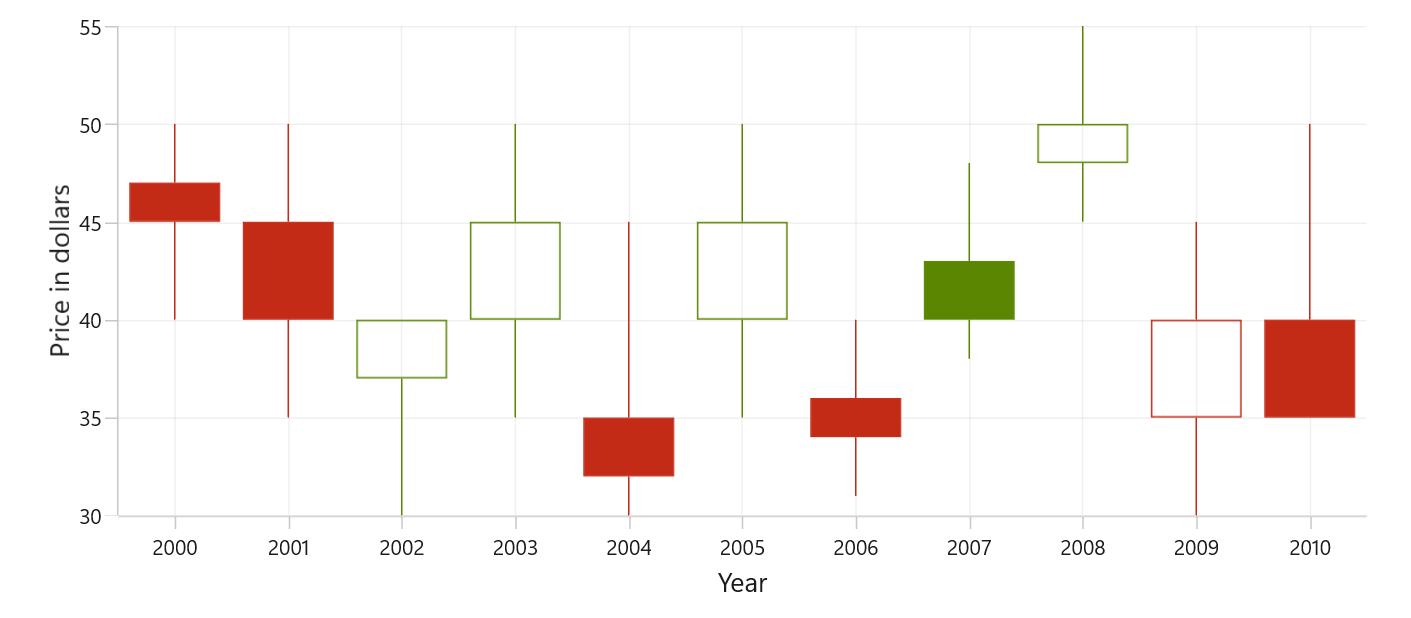
Bull and Bear Color
Set BullishBrush for candles where the close is equal to or higher than the open (bullish/increasing periods), and BearishBrush for segments where the close is lower than the open (bearish/decreasing periods). If not specified, the series falls back to its default brush.
<chart:SfCartesianChart>
    <chart:SfCartesianChart.XAxes>
        <chart:CategoryAxis/>
    </chart:SfCartesianChart.XAxes>

    <chart:SfCartesianChart.YAxes>
        <chart:NumericalAxis/>
    </chart:SfCartesianChart.YAxes>

    <chart:CandleSeries
        ItemsSource="{Binding StockData}"
        XBindingPath="Year"
        Open="Open"
        High="High"
        Low="Low"
        Close="Close"
        BullishBrush="Blue"
        BearishBrush="Orange"/>
</chart:SfCartesianChart>
SfCartesianChart chart = new SfCartesianChart();
CategoryAxis primaryAxis = new CategoryAxis();
chart.XAxes.Add(primaryAxis);
NumericalAxis secondaryAxis = new NumericalAxis();
chart.YAxes.Add(secondaryAxis);
CandleSeries series = new CandleSeries()
{
ItemsSource = new ViewModel().StockData,
XBindingPath = "Year",
Open = "Open",
High = "High",
Low = "Low",
Close = "Close",
BullishBrush = new SolidColorBrush(Colors.Blue),
BearishBrush = new SolidColorBrush(Colors.Orange),
};
chart.Series.Add(series);
this.Content = chart;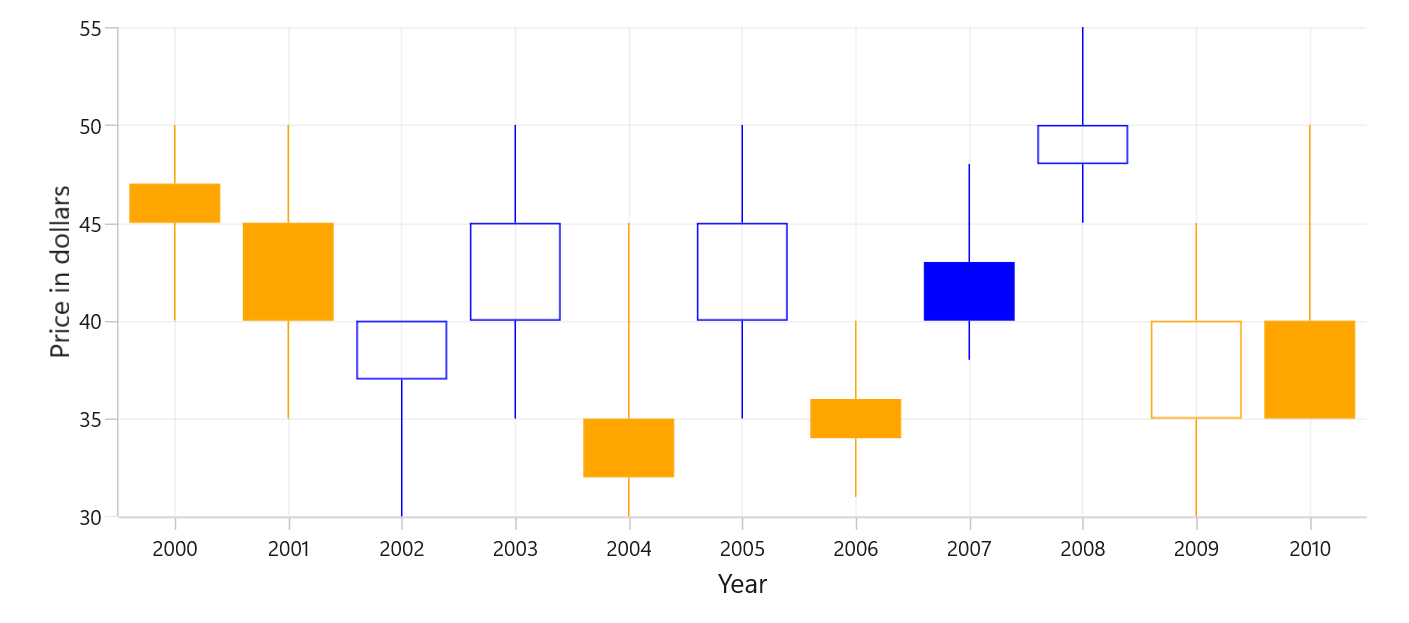
EnableSolidCandle
In Candle Series, the EnableSolidCandle property is used to specify whether the candle segment should be filled or hollow. The default value of this property is false.
- When
EnableSolidCandle = false(hollow mode), the fill state and color are determined by comparing the previous day close to the current day close:- previous day close > current day close → bearish (uses
BearishBrush) - previous day close <= current day close → bullish (uses
BullishBrush)
- previous day close > current day close → bearish (uses
- When
EnableSolidCandle = true(solid mode), candles are filled and colored by comparing the current day open and close:- current day close >= current day open → bullish (uses
BullishBrush) - current day close < current day open → bearish (uses
BearishBrush)
- current day close >= current day open → bullish (uses
<chart:SfCartesianChart>
    <chart:SfCartesianChart.XAxes>
        <chart:CategoryAxis/>
    </chart:SfCartesianChart.XAxes>

    <chart:SfCartesianChart.YAxes>
        <chart:NumericalAxis/>
    </chart:SfCartesianChart.YAxes>

    <chart:CandleSeries
        ItemsSource="{Binding StockData}"
        XBindingPath="Year"
        Open="Open"
        High="High"
        Low="Low"
        Close="Close"
        EnableSolidCandle="True"/>
</chart:SfCartesianChart>
SfCartesianChart chart = new SfCartesianChart();
CategoryAxis primaryAxis = new CategoryAxis();
chart.XAxes.Add(primaryAxis);
NumericalAxis secondaryAxis = new NumericalAxis();
chart.YAxes.Add(secondaryAxis);
CandleSeries series = new CandleSeries()
{
ItemsSource = new ViewModel().StockData,
XBindingPath = "Year",
Open = "Open",
High = "High",
Low = "Low",
Close = "Close",
EnableSolidCandle = true,
};
chart.Series.Add(series);
this.Content = chart;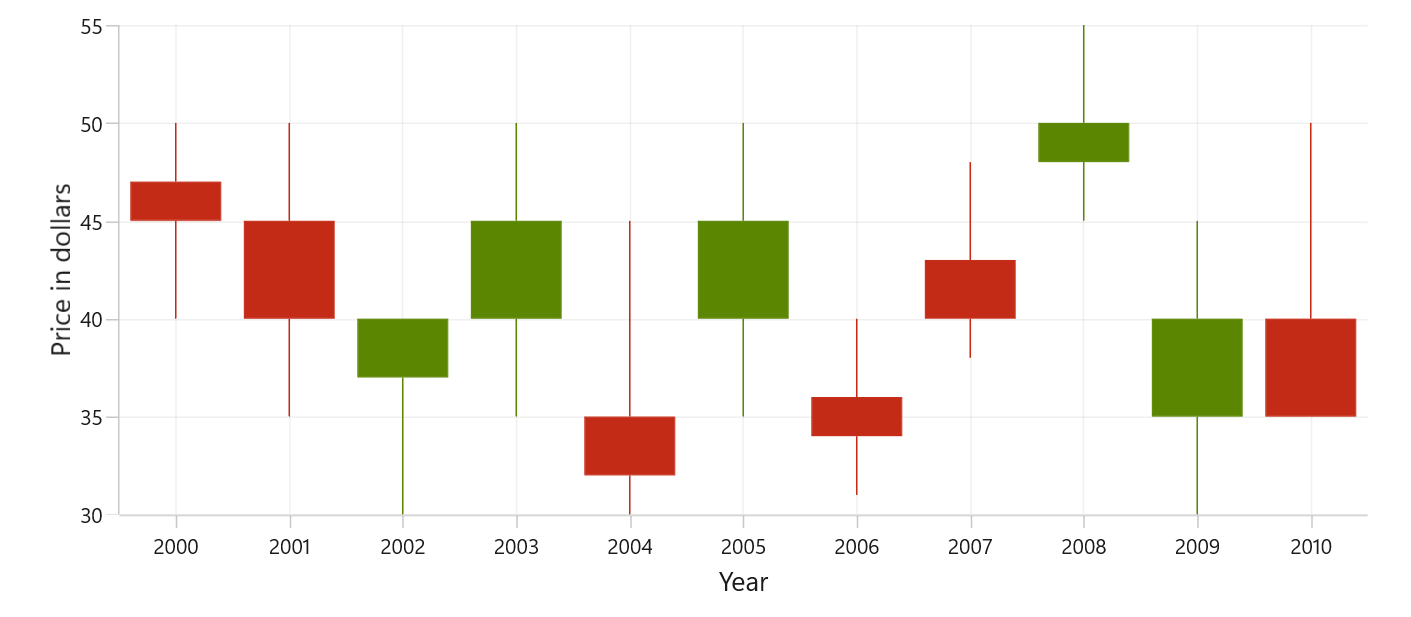
Segment Width
The SegmentWidth property sets the width of each data point (candle) in the series. It accepts values between 0 and 1, the default value is 0.8. A value of 1.0 makes the candle occupy the full category width, while smaller values make the candle narrower.
<chart:SfCartesianChart>
    <chart:SfCartesianChart.XAxes>
        <chart:CategoryAxis/>
    </chart:SfCartesianChart.XAxes>

    <chart:SfCartesianChart.YAxes>
        <chart:NumericalAxis/>
    </chart:SfCartesianChart.YAxes>

    <chart:CandleSeries
        ItemsSource="{Binding StockData}"
        XBindingPath="Year"
        Open="Open"
        High="High"
        Low="Low"
        Close="Close"
        SegmentWidth="0.4"/>
</chart:SfCartesianChart>
SfCartesianChart chart = new SfCartesianChart();
CategoryAxis primaryAxis = new CategoryAxis();
chart.XAxes.Add(primaryAxis);
NumericalAxis secondaryAxis = new NumericalAxis();
chart.YAxes.Add(secondaryAxis);
CandleSeries series = new CandleSeries()
{
ItemsSource = new ViewModel().StockData,
XBindingPath = "Year",
Open = "Open",
High = "High",
Low = "Low",
Close = "Close",
SegmentWidth = 0.4,
};
chart.Series.Add(series);
this.Content = chart;