How can I help you?
Types of Axis in WinUI Chart (SfCartesianChart)
17 Dec 202515 minutes to read
Cartesian chart supports the following types of chart axis.
- NumericalAxis
- CategoryAxis
- DateTimeAxis
- LogarithmicAxis
Numerical Axis
NumericalAxis is used to plot numerical values to the chart. NumericalAxis can be added for both XAxes and YAxes.
<chart:SfCartesianChart>
. . .
<chart:SfCartesianChart.XAxes>
    <chart:NumericalAxis/>
</chart:SfCartesianChart.XAxes>
<chart:SfCartesianChart.YAxes>
    <chart:NumericalAxis/>
</chart:SfCartesianChart.YAxes>

</chart:SfCartesianChart>
SfCartesianChart chart = new SfCartesianChart();
. . .
chart.XAxes.Add(new NumericalAxis());
chart.YAxes.Add(new NumericalAxis());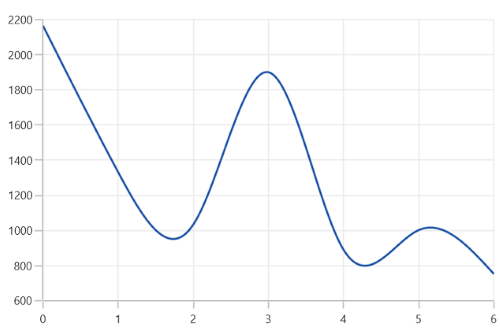
Interval
Axis interval can be customized by using the Interval property. By default, interval will be calculated based on the minimum and maximum value of the provided data.
<chart:SfCartesianChart>
. . .
<chart:SfCartesianChart.XAxes>
    <chart:NumericalAxis Interval="10" />
</chart:SfCartesianChart.XAxes>
<chart:SfCartesianChart.YAxes>
    <chart:NumericalAxis/>
</chart:SfCartesianChart.YAxes>

</chart:SfCartesianChart>
SfCartesianChart chart = new SfCartesianChart();
. . .
NumericalAxis primaryAxis = new NumericalAxis()
{
Interval = 10,
};
chart.XAxes.Add(primaryAxis);
chart.YAxes.Add(new NumericalAxis());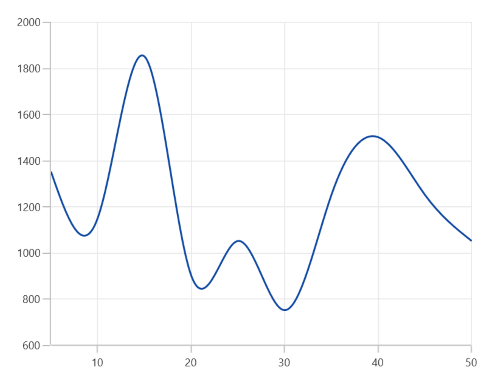
Customizing the Range
Maximum and Minimum properties of axis is used for setting the maximum and minimum value of the axis range respectively.
NOTE
If minimum or maximum value is set, the other value is calculated by default internally.
<chart:SfCartesianChart.YAxes>
    <chart:NumericalAxis Maximum="2750"
                         Minimum="250"
			 Interval="250"/>
</chart:SfCartesianChart.YAxes>
NumericalAxis secondaryAxis = new NumericalAxis()
{
Maximum = 2750,
Minimum = 250,
Interval = 250
};
chart.YAxes.Add(secondaryAxis);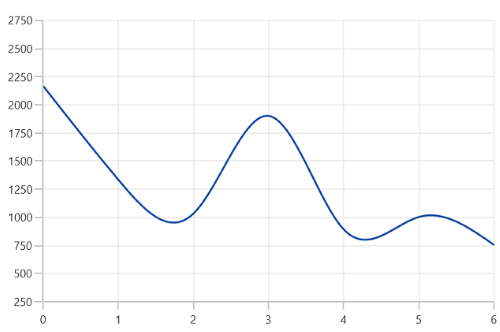
Category Axis
The CategoryAxis is an indexed based axis that plots values based on the index of the data point collection. The points are equally spaced here.
<chart:SfCartesianChart>
. . .
<chart:SfCartesianChart.XAxes>
    <chart:CategoryAxis/>
</chart:SfCartesianChart.XAxes>

</chart:SfCartesianChart>
SfCartesianChart chart = new SfCartesianChart();
. . .
chart.XAxes.Add(new CategoryAxis());
Label placement
The LabelPlacement property in CategoryAxis is used to placed the axis labels based on ticks and between ticks. The default value of LabelPlacement is OnTicks.
<chart:SfCartesianChart>
. . .
<chart:SfCartesianChart.XAxes>
    <chart:CategoryAxis LabelPlacement="BetweenTicks"/>
</chart:SfCartesianChart.XAxes>

</chart:SfCartesianChart>
SfCartesianChart chart = new SfCartesianChart();
. . .
CategoryAxis primaryAxis = new CategoryAxis()
{
LabelPlacement = LabelPlacement.BetweenTicks
};
chart.XAxes.Add(primaryAxis);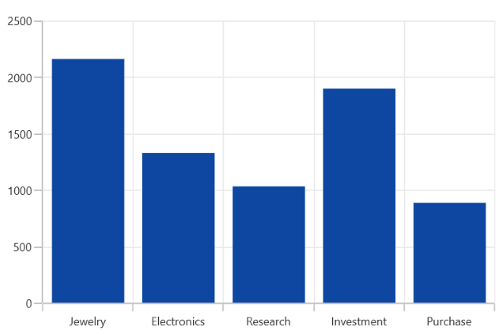
Interval
By default, the CategoryAxis axis labels are display with fixed interval 1. It can customized by using the Interval property of axis.
<chart:SfCartesianChart>
. . .
<chart:SfCartesianChart.XAxes>
    <chart:CategoryAxis Interval="2" />
</chart:SfCartesianChart.XAxes>
<chart:SfCartesianChart.YAxes>
    <chart:NumericalAxis/>
</chart:SfCartesianChart.YAxes>

</chart:SfCartesianChart>
SfCartesianChart chart = new SfCartesianChart();
. . .
CategoryAxis primaryAxis = new CategoryAxis()
{
Interval = 2,
};
chart.XAxes.Add(primaryAxis);
chart.YAxes.Add(new NumericalAxis());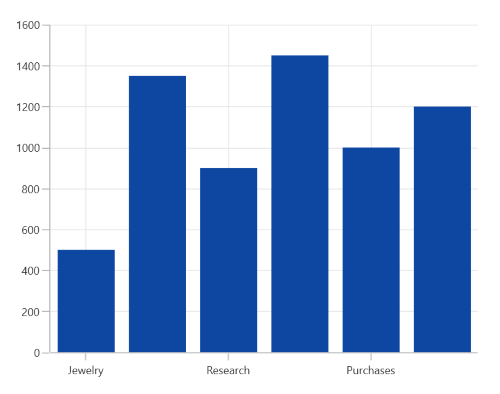
DateTime Axis
DateTimeAxis is used to plot DateTime values. The DateTimeAxis is widely used to make financial charts in places like the Stock Market, where index plotting is done every day.
<chart:SfCartesianChart>
. . .
<chart:SfCartesianChart.XAxes>
    <chart:DateTimeAxis>
        <chart:DateTimeAxis.LabelStyle>
            <chart:LabelStyle LabelFormat="MMM-yy" />
        </chart:DateTimeAxis.LabelStyle>
    </chart:DateTimeAxis>
</chart:SfCartesianChart.XAxes>

</chart:SfCartesianChart>
SfCartesianChart chart = new SfCartesianChart();
. . .
DateTimeAxis primaryAxis = new DateTimeAxis()
{
LabelStyle = new LabelStyle() { LabelFormat= "MMM-yy" }
};
chart.XAxes.Add(primaryAxis);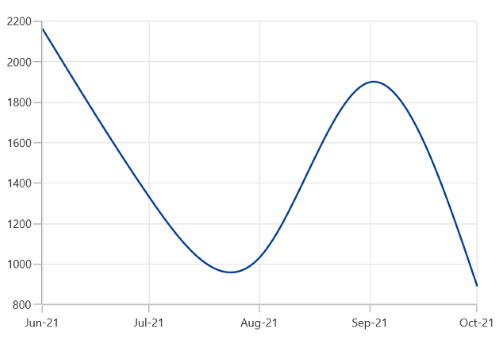
Interval
In DateTimeAxis, intervals can be customized by using the Interval and IntervalType properties. For example, setting Interval as 6 and IntervalType as Months will consider 6 months as interval.
<chart:SfCartesianChart>
. . .
<chart:SfCartesianChart.XAxes>
    <chart:DateTimeAxis Interval="6"
                        IntervalType="Months" >
        <chart:DateTimeAxis.LabelStyle>
            <chart:LabelStyle LabelFormat="MMM-yy" />
        </chart:DateTimeAxis.LabelStyle>
    </chart:DateTimeAxis>
</chart:SfCartesianChart.XAxes>
<chart:SfCartesianChart.YAxes>
    <chart:NumericalAxis/>
</chart:SfCartesianChart.YAxes>

</chart:SfCartesianChart>
SfCartesianChart chart = new SfCartesianChart();
. . .
DateTimeAxis primaryAxis = new DateTimeAxis()
{
Interval = 6,
IntervalType = DateTimeIntervalType.Months,
LabelStyle = new LabelStyle() { LabelFormat= "MMM-yy" }
};
chart.XAxes.Add(primaryAxis);
chart.YAxes.Add(new NumericalAxis());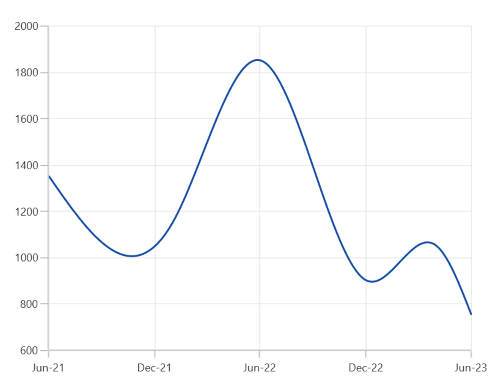
Customizing the Range
Minimum and Maximum properties behavior is same as in NumericalAxis instead of setting numerical value, have to set date time values.
<chart:SfCartesianChart>
. . .
<chart:SfCartesianChart.XAxes>
    <chart:DateTimeAxis Minimum="2021/05/1"
                        Maximum="2021/11/01" >
        <chart:DateTimeAxis.LabelStyle>
            <chart:LabelStyle LabelFormat="MMM-yy" />
        </chart:DateTimeAxis.LabelStyle>
    </chart:DateTimeAxis>
</chart:SfCartesianChart.XAxes>

</chart:SfCartesianChart>
SfCartesianChart chart = new SfCartesianChart();
. . .
DateTimeAxis primaryAxis = new DateTimeAxis()
{
Minimum = new DateTime(2021,05,10),
Maximum = new DateTime(2021,11,01),
LabelStyle = new LabelStyle() { LabelFormat= "MMM-yy" }
};
chart.XAxes.Add(primaryAxis);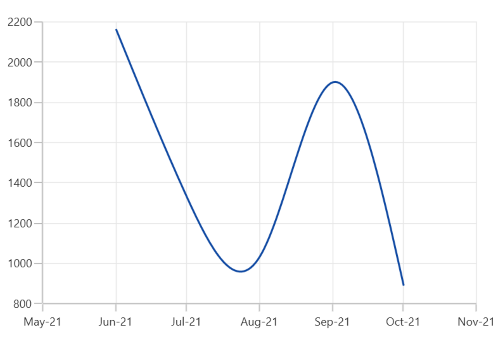
Logarithmic Axis
The LogarithmicAxis uses a logarithmic scale, ideal for visualizing data with large value differences. It can be applied to both the X and Y axes of a chart, allows customization of the logarithmic base, and dynamically calculates ranges to effectively display wide-ranging datasets.
<chart:SfCartesianChart>
. . .
<chart:SfCartesianChart.YAxes>
    <chart:LogarithmicAxis />
</chart:SfCartesianChart.YAxes>

</chart:SfCartesianChart>
SfCartesianChart chart = new SfCartesianChart();
. . .
LogarithmicAxis secondaryAxis = new LogarithmicAxis()
chart.YAxes.Add(secondaryAxis);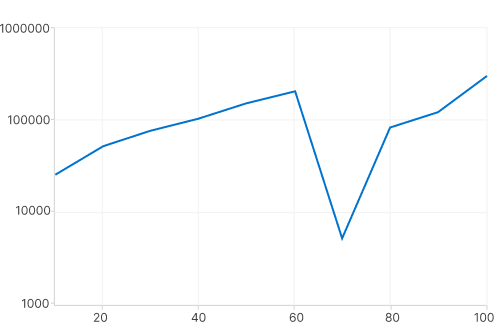
Interval
The Axis interval can be customized using the Interval property of the axis. By default, the interval is calculated based on the minimum and maximum values of the provided data, with a default value of 1.
<chart:SfCartesianChart>
. . .
<chart:SfCartesianChart.YAxes>
    <chart:LogarithmicAxis Interval="10" />
</chart:SfCartesianChart.YAxes>

</chart:SfCartesianChart>
SfCartesianChart chart = new SfCartesianChart();
. . .
LogarithmicAxis secondaryAxis = new LogarithmicAxis()
{
Interval = 10,
};
chart.YAxes.Add(secondaryAxis);Customizing the Range
The range of the logarithmic axis can be customized using the Minimum and Maximum properties of the LogarithmicAxis. By default, the range is automatically calculated to align with the provided data.
<chart:SfCartesianChart>
. . .
<chart:SfCartesianChart.YAxes>
    <chart:LogarithmicAxis Minimum="100" Maximum="100000" />
</chart:SfCartesianChart.YAxes>

</chart:SfCartesianChart>
SfCartesianChart chart = new SfCartesianChart();
. . .
LogarithmicAxis secondaryAxis = new LogarithmicAxis()
{
Minimum = 100,
Maximum = 100000,
};
chart.YAxes.Add(secondaryAxis);Customizing the Logarithmic base
The logarithmic axis base can be customized using the LogarithmicBase property. The default logarithmic base value is 10.
<chart:SfCartesianChart>
. . .
<chart:SfCartesianChart.YAxes>
    <chart:LogarithmicAxis LogarithmicBase="2" />
</chart:SfCartesianChart.YAxes>

</chart:SfCartesianChart>
SfCartesianChart chart = new SfCartesianChart();
. . .
LogarithmicAxis secondaryAxis = new LogarithmicAxis()
{
LogarithmicBase = 2,
};
chart.YAxes.Add(secondaryAxis);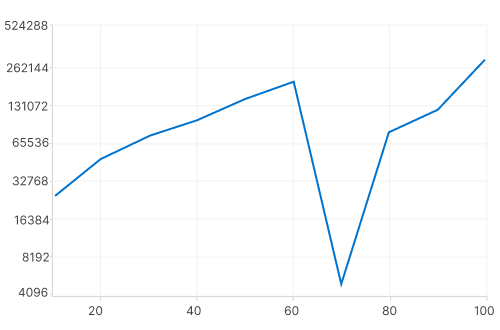
Inversed
Axis can be inverted by using the IsInversed property. The default value of this property is False.
<chart:SfCartesianChart>
. . .
<chart:SfCartesianChart.YAxes>
    <chart:NumericalAxis IsInversed="True"/>
</chart:SfCartesianChart.YAxes>

</chart:SfCartesianChart>
SfCartesianChart chart = new SfCartesianChart();
. . .
NumericalAxis secondaryAxis = new NumericalAxis();
secondaryAxis.IsInversed = true;
chart.YAxes.Add(secondaryAxis);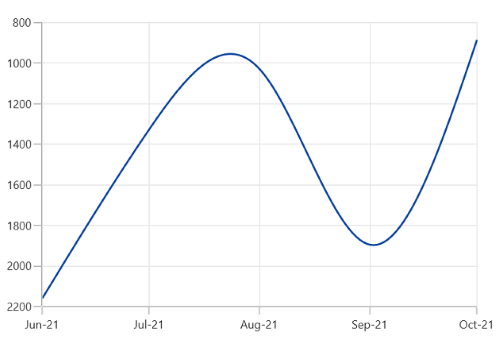
Opposed Axis
Cartesian charts allow positioning the axis to opposite position by setting the OpposedPosition property. The default value of this property is False.
<chart:SfCartesianChart>
. . .
<chart:SfCartesianChart.YAxes>
    <chart:NumericalAxis OpposedPosition="True"/>
</chart:SfCartesianChart.YAxes>

</chart:SfCartesianChart>
SfCartesianChart chart = new SfCartesianChart();
. . .
NumericalAxis secondaryAxis = new NumericalAxis();
secondaryAxis.OpposedPosition = true;
chart.YAxes.Add(secondaryAxis);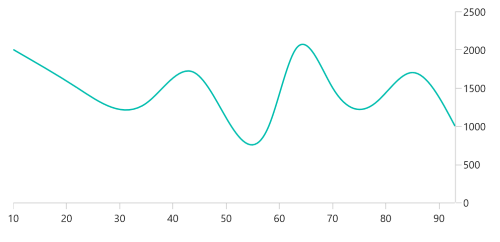
Multiple Axes
Cartesian charts provides support to arrange the multiple series inside the same chart area with specified x-axis and y-axis. There are two properties XAxisName and YAxisName in all the Cartesian series type, which is used to provide multiple axes support. These axes can be arranged in a stacking order or in a side by side pattern.
By default, all the series are plotted based on the 0th index axis of XAxes and YAxes.
<chart:SfCartesianChart>
    . . .
	<chart:SfCartesianChart.XAxes>
		<chart:DateTimeAxis ShowMajorGridLines="False" />
	</chart:SfCartesianChart.XAxes>

	<chart:SfCartesianChart.YAxes>
		<chart:NumericalAxis ShowMajorGridLines="False" />
		<chart:NumericalAxis Name="Series_YAxis" ShowMajorGridLines="False" />
	</chart:SfCartesianChart.YAxes>

    <chart:SfCartesianChart.Series>
        <chart:SfCartesianChart.Series>
            <chart:ColumnSeries ItemsSource="{Binding Data1}"
                                XBindingPath="Date"
                                YBindingPath="Value"
				YAxisName="Series_YAxis">
            </chart:ColumnSeries>
            <chart:SplineSeries ItemsSource="{Binding Data}"
                                XBindingPath="Date"
                                YBindingPath="Value"/>
    </chart:SfCartesianChart.Series>

</chart:SfCartesianChart>
SfCartesianChart chart = new SfCartesianChart();
. . .
DateTimeAxis primaryAxis = new DateTimeAxis()
{
ShowMajorGridLines = false
};
chart.XAxes.Add(primaryAxis);
NumericalAxis secondaryAxis = new NumericalAxis()
{
ShowMajorGridLines = false
};
secondaryAxis.Name = "Series_YAxis";
chart.YAxes.Add(secondaryAxis);
NumericalAxis secondaryAxis1 = new NumericalAxis();
chart.YAxes.Add(secondaryAxis1);
ColumnSeries series1 = new ColumnSeries()
{
YAxisName = "Series_YAxis"
ItemsSource = new ViewModel().Demands,
XBindingPath = "Demand",
YBindingPath = "Year2011"
};
SplineSeries series2 = new SplineSeries()
{
ItemsSource = new ViewModel().Demands,
XBindingPath = "Date",
YBindingPath = "Year2011",
};
chart.Series.Add(series1);
chart.Series.Add(series2);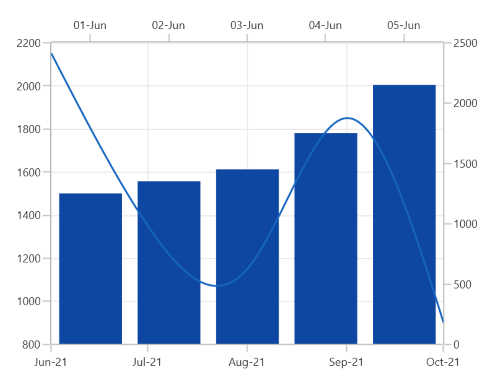
In the above image, the ColumnSeries is plotted based on additional axes of YAxes collection, and SplineSeries is plotted based on axis of the collection’s 0th index.
Events
ActualRangeChanged
The ActualRangeChanged event is triggered when the actual range of the axis is changed. The argument contains the following information:
- ActualMinimum - used to get the actual minimum value of the axis.
- ActualMaximum - used to get the actual maximum value of the axis.
NOTE
The actual range is changed by specifying the ZoomPosition and ZoomFactor properties or zooming the chart interactively.
LabelCreated
The LabelCreated event is triggered when the axis label is created. The argument contains the following information:
- Label - Used to get or set the text of axis label.
- Position - Used to get the position of label.
- LabelStyle - Used to customize the appearance of axis labels.