Area in UWP Charts (SfChart)
7 Jan 202521 minutes to read
Chart area represents the entire chart and all its elements. It’s a virtual rectangular area that includes all the chart elements like axis, legends, series etc.
The following are the major properties of chart(SfChart):
-
PrimaryAxis– Gets or sets the horizontal x axis for the chart. -
SecondaryAxis– Gets or sets the vertical y axis for the chart. -
Legend– Gets or sets the legend for the chart. -
Series– Gets or sets the list of series in the chart. -
TechnicalIndicators– Gets or sets the various financial indicators for the chart. -
Behaviors– Used to add one more interactive features to the chart. -
Area- Gets the instance of chart.
Chart Header
Header property is used to define the title for the chart. This allows you to add any object (.Net object) as content for chart title.
<syncfusion:SfChart Header="Usage of Metals" />SfChart chart = new SfChart();
chart.Header = "Usage of Metals";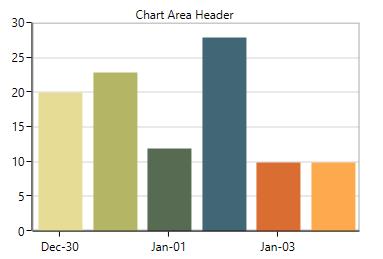
Header can be positioned left or right side of the chart using HorizontalHeaderAlignment property.
Also you can add more customization for the header as below:
<chart:SfChart.Header>

<Border BorderThickness="0.5" BorderBrush="Black" Margin="10" CornerRadius="5">

<TextBlock FontSize="14" Text="Chart Area Header" Margin="5">

<TextBlock.Effect>

<DropShadowEffect Color="Black"

Opacity="0.5" />

</TextBlock.Effect>

</TextBlock>

</Border>

</chart:SfChart.Header>
Border border = new Border()
{
BorderThickness = new Thickness(0.5),
BorderBrush = new SolidColorBrush(Colors.Black),
Margin = new Thickness(10),
CornerRadius = new CornerRadius(5)
};
TextBlock textBlock = new TextBlock()
{
Text = "Chart Area Header",
Margin = new Thickness(5),
FontSize = 14
};
textBlock.Effect = new DropShadowEffect()
{
Color = Colors.Black,
Opacity = 0.5
};
border.Child = textBlock;
chart.Header = border;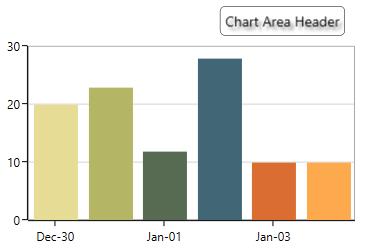
NOTE
Here, HorizontalHeaderAlignment is set as ‘Right’.
Area Customization
SfChart provides the properties like AreaBorderBrush, AreaBorderThickness, AreaBackground and Background for customizing the plot area.
The following code examples illustrates the usage of these properties:
<chart:SfChart Height="250" Width="350"

Header="Chart Area Header"

AreaBackground="Cyan"

Background="LightGray"

AreaBorderBrush="Gray"

AreaBorderThickness="3" >
SfChart chart = new SfChart();
chart.Header = "Chart Area Header";
chart.AreaBackground = new SolidColorBrush(Colors.Cyan);
chart.Background = new SolidColorBrush(Colors.LightGray);
chart.AreaBorderBrush = new SolidColorBrush(Colors.Gray);
chart.AreaBorderThickness = new Thickness(3);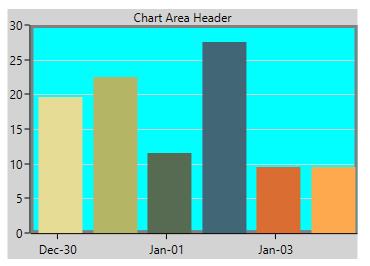
Multiple Area
You can split plot area into multiple rows and columns using ChartRowDefinition and ChartColumnDefinition like Grid panel’s row and column definition.
The following code example demonstrates, how you can create multiple panes in the chart area:
<chart:SfChart >

<!--Adding row definition to the chart-->

<chart:SfChart.RowDefinitions>

<chart:ChartRowDefinition/>

<chart:ChartRowDefinition/>

</chart:SfChart.RowDefinitions>

<!--Adding column definition to the chart-->

<chart:SfChart.ColumnDefinitions>

<chart:ChartColumnDefinition/>

<chart:ChartColumnDefinition/>

</chart:SfChart.ColumnDefinitions>

<chart:SfChart.PrimaryAxis>

<chart:CategoryAxis chart:ChartBase.ColumnSpan="2"/>

</chart:SfChart.PrimaryAxis>


<chart:SfChart.SecondaryAxis>

<chart:NumericalAxis  PlotOffset="13" chart:ChartBase.ColumnSpan="2" />

</chart:SfChart.SecondaryAxis>


<chart:ColumnSeries Palette="LightCandy"

ItemsSource="{Binding MetalsDetail}"

XBindingPath="MetalName"

YBindingPath="MetalCount1"

/>

<chart:ColumnSeries Palette="Metro"

ItemsSource="{Binding MetalsDetail}"

XBindingPath="MetalName"

YBindingPath="MetalCount" >

<chart:ColumnSeries.YAxis>

<chart:NumericalAxis  PlotOffset="10"

chart:SfChart.Row="1" >

</chart:NumericalAxis>

</chart:ColumnSeries.YAxis>

</chart:ColumnSeries>

</chart:SfChart>
SfChart chart = new SfChart();
chart.RowDefinitions.Add(new ChartRowDefinition());
chart.RowDefinitions.Add(new ChartRowDefinition());
chart.ColumnDefinitions.Add(new ChartColumnDefinition());
chart.ColumnDefinitions.Add(new ChartColumnDefinition());
CategoryAxis xAxis = new CategoryAxis();
ChartBase.SetColumnSpan(xAxis, 2);
chart.PrimaryAxis = xAxis;
NumericalAxis yAxis = new NumericalAxis();
yAxis.PlotOffset = 13;
ChartBase.SetColumnSpan(yAxis, 2);
chart.SecondaryAxis = yAxis;
ColumnSeries columnSeries1 = new ColumnSeries()
{
ItemsSource = new ViewModel().MetalsDetail,
XBindingPath = "MetalName",
YBindingPath = "MetalCount",
Palette = ChartColorPalette.LightCandy,
};
NumericalAxis axis = new NumericalAxis();
axis.PlotOffset = 10;
SfChart.SetRow(axis, 1);
ColumnSeries columnSeries2 = new ColumnSeries()
{
ItemsSource = new ViewModel().MetalsDetail,
XBindingPath = "MetalName",
YBindingPath = "MetalCount1",
Palette = ChartColorPalette.Metro,
YAxis = axis
};
chart.Series.Add(columnSeries1);
chart.Series.Add(columnSeries2);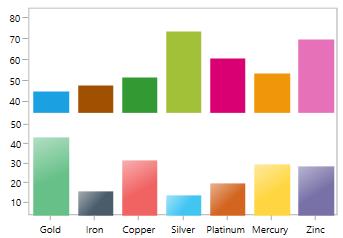
Column Span and Row Span
These can be used to specify the number of column or rows up to which the axis can extend. Same like Grid’s RowSpan or ColumnSpan property, it is also an attached property.
You can set the row span in chart like the following code example.
<chart:SfChart>

<!--Adding row definition to the chart-->

<chart:SfChart.RowDefinitions>

<chart:ChartRowDefinition/>

<chart:ChartRowDefinition/>

</chart:SfChart.RowDefinitions>

<chart:SfChart.PrimaryAxis>

<chart:CategoryAxis  chart:ChartBase.RowSpan="2"

chart:SfChart.Row="0"

TickLinesPosition="Outside">

</chart:CategoryAxis>

</chart:SfChart.PrimaryAxis>

<chart:SfChart.SecondaryAxis>

<chart:NumericalAxis />

</chart:SfChart.SecondaryAxis>

<chart:ColumnSeries XBindingPath="MetalName"

ItemsSource="{Binding MetalsDetail}"

YBindingPath="MetalCount1"

/>


<chart:LineSeries Interior="CadetBlue" XBindingPath="MetalName"

ItemsSource="{Binding MetalsDetail}"

YBindingPath="MetalCount">

<chart:LineSeries.YAxis>

<chart:NumericalAxis chart:ChartBase.RowSpan="2">

</chart:NumericalAxis>

</chart:LineSeries.YAxis>

</chart:LineSeries>

</chart:SfChart>
SfChart chart = new SfChart();
chart.RowDefinitions.Add(new ChartRowDefinition());
chart.RowDefinitions.Add(new ChartRowDefinition());
chart.ColumnDefinitions.Add(new ChartColumnDefinition());
chart.ColumnDefinitions.Add(new ChartColumnDefinition());
CategoryAxis xAxis = new CategoryAxis();
xAxis.TickLinesPosition = AxisElementPosition.Outside;
ChartBase.SetColumnSpan(xAxis, 2);
SfChart.SetRow(xAxis, 0);
chart.PrimaryAxis = xAxis;
NumericalAxis yAxis = new NumericalAxis();
ChartBase.SetColumnSpan(yAxis, 2);
chart.SecondaryAxis = yAxis;
ColumnSeries columnSeries1 = new ColumnSeries()
{
ItemsSource = new ViewModel().MetalsDetail,
XBindingPath = "MetalName",
YBindingPath = "MetalCount1",
};
NumericalAxis axis = new NumericalAxis();
axis.PlotOffset = 10;
ChartBase.SetColumnSpan(axis, 2);
LineSeries lineSeries = new LineSeries()
{
ItemsSource = new ViewModel().MetalsDetail,
XBindingPath = "MetalName",
YBindingPath = "MetalCount",
Interior = new SolidColorBrush(Colors.CadetBlue),
YAxis = axis
};
chart.Series.Add(columnSeries1);
chart.Series.Add(lineSeries);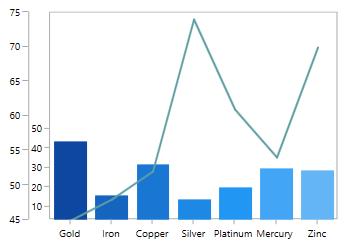
Placing Series Side-By-Side
It defines the placement pattern of bar type series like Column, Bar, RangeColumn, etc.
It is a Boolean property and its default value is true so the segment will be placed adjacent to each other (Clustered).
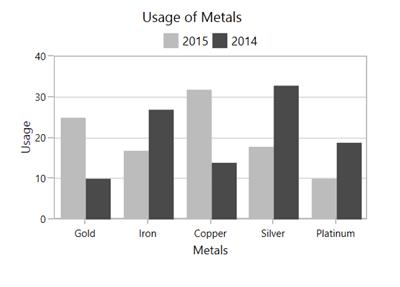
The following code example and image illustrates the placement of series while setting SideBySideSeriesPlacement as false.
<chart:SfChart x:Name="columnChart" AreaBorderBrush="DarkGray"

Header="Usage of Metals"

SideBySideSeriesPlacement="False"

AreaBorderThickness="1,1,1,1">

<chart:SfChart.PrimaryAxis>

<chart:CategoryAxis  Header="Metals"/>

</chart:SfChart.PrimaryAxis>

<chart:SfChart.SecondaryAxis>

<chart:NumericalAxis Header="Usage" />

</chart:SfChart.SecondaryAxis>

<chart:SfChart.Legend>

<chart:ChartLegend Visibility="Visible" />

</chart:SfChart.Legend>

<chart:ColumnSeries Interior="#bcbcbc"

ItemsSource="{Binding MetalsDetail}" Label="2015"

XBindingPath="MetalName"

YBindingPath="MetalCount" />

<chart:ColumnSeries ItemsSource="{Binding MetalsDetail}"

SegmentSpacing="0.5"

Interior="#4a4a4a"  XBindingPath="MetalName"

Label="2014" YBindingPath="MetalCount1"/>

</chart:SfChart>
SfChart chart = new SfChart();
chart.Header = "Usage of Metals";
chart.AreaBorderBrush = new SolidColorBrush(Colors.DarkGray);
chart.SideBySideSeriesPlacement = false;
chart.AreaBorderThickness = new Thickness(1);
chart.PrimaryAxis = new CategoryAxis()
{
Header = "Metals"
};
chart.SecondaryAxis = new NumericalAxis()
{
Header = "Usage"
};
chart.Legend = new ChartLegend()
{
Visibility = Visibility.Visible
};
ColumnSeries columnSeries1 = new ColumnSeries()
{
ItemsSource = new ViewModel().MetalsDetail,
XBindingPath = "MetalName",
YBindingPath = "MetalCount",
Label = "2015",
Interior = new SolidColorBrush(Color.FromRgb(0xbc, 0xbc, 0xbc)),
};
ColumnSeries columnSeries2 = new ColumnSeries()
{
ItemsSource = new ViewModel().MetalsDetail,
XBindingPath = "MetalName",
YBindingPath = "MetalCount1",
Label = "2014",
SegmentSpacing = 0.5,
Interior = new SolidColorBrush(Color.FromRgb(0x4a, 0x4a, 0x4a)),
};
chart.Series.Add(columnSeries1);
chart.Series.Add(columnSeries2);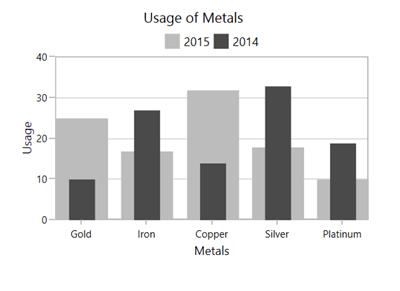
NOTE
As the series will be placed one over the other(overlapped), to differentiate between the series the
SegmentSpacingis used.
Serialization
SfChart supports serialization and deserialization for save the settings of the chart and reload.
This can be done using Serialize and Deserialize methods as in below code example:
<chart:SfChart Margin="10" x:Name="chart" Header="Defect Rates">

<chart:SfChart.Annotations>

    <chart:RectangleAnnotation X1="0" X2="2" Y1="20"

                               Y2="30" CanDrag="True"

                               CanResize="True"/>

</chart:SfChart.Annotations>

<chart:SfChart.PrimaryAxis>

    <chart:CategoryAxis Header="X Axis" />

</chart:SfChart.PrimaryAxis>

<chart:SfChart.SecondaryAxis>

    <chart:NumericalAxis Header="Y Axis" />

</chart:SfChart.SecondaryAxis>

<chart:ColumnSeries ItemsSource="{Binding CategoricalDatas}"

                    XBindingPath="Category"

                    YBindingPath="Value">

</chart:ColumnSeries>

</chart:SfChart>


Serialized Chart

<SfChart Header="Defect Rates" Name="chart" Margin="10,10,10,10" Width="500" Height="420"
         xmlns="http://schemas.syncfusion.com/wpf"
         xmlns:s="clr-namespace:System;assembly=mscorlib"
         xmlns:av="http://schemas.microsoft.com/winfx/2006/xaml/presentation">

<SfChart.PrimaryAxis>

    <CategoryAxis Header="X Axis">

        <CategoryAxis.StripLines>
             <ChartStripLines />
        </CategoryAxis.StripLines>

    </CategoryAxis>

</SfChart.PrimaryAxis>

<SfChart.SecondaryAxis>

    <NumericalAxis Header="Y Axis">

        <NumericalAxis.StripLines>
            <ChartStripLines />
        </NumericalAxis.StripLines>

    </NumericalAxis>

</SfChart.SecondaryAxis>

<SfChart.Behaviors>
    <ChartBehaviorsCollection />
</SfChart.Behaviors>

<SfChart.Annotations>

    <AnnotationCollection>

        <RectangleAnnotation CanDrag="True" CanResize="True">
            <RectangleAnnotation.Y2>
                <s:Int32>30</s:Int32>
            </RectangleAnnotation.Y2>
            <RectangleAnnotation.X2>
                <s:Int32>2</s:Int32>
            </RectangleAnnotation.X2>
            <RectangleAnnotation.X1>
                <s:Int32>0</s:Int32>
            </RectangleAnnotation.X1>
            <RectangleAnnotation.Y1>
                <s:Int32>20</s:Int32>
            </RectangleAnnotation.Y1>
        </RectangleAnnotation>

    </AnnotationCollection>

</SfChart.Annotations>

<SfChart.ColumnDefinitions>
    <ChartColumnDefinitions />
</SfChart.ColumnDefinitions>

<SfChart.RowDefinitions>
    <ChartRowDefinitions />
</SfChart.RowDefinitions>

<ColumnSeries YBindingPath="Value"
              ItemsSource="{av:Binding Path=CategoricalData}"
              XBindingPath="Category"
              Name="series"
              xmlns="http://schemas.syncfusion.com/wpf"
              xmlns:av="http://schemas.microsoft.com/winfx/2006/xaml/presentation">

<ColumnSeries.Trendlines>
    <ChartTrendLineCollection />
</ColumnSeries.Trendlines>

<ColumnSeries.LegendIconTemplate>
    <av:DataTemplate>
        <av:Rectangle Stretch="Fill"
        Fill="{av:Binding Path=Interior}"
        Stroke="{av:Binding Path=Stroke}"
        StrokeThickness="{av:Binding Path=StrokeThickness}" />
    </av:DataTemplate>
</ColumnSeries.LegendIconTemplate>

</ColumnSeries>

</SfChart>
SfChart chart = new SfChart();
chart.Header = "Defect Rates";
chart.PrimaryAxis = new CategoryAxis()
{
Header = "X Axis"
};
chart.SecondaryAxis = new NumericalAxis()
{
Header = "Y Axis"
};
RectangleAnnotation annotation = new RectangleAnnotation()
{
X1 = 0, X2 = 2,
Y1 = 20, Y2 = 30,
CanDrag = true, CanResize = true
};
chart.Annotations.Add(annotation);
ColumnSeries columnSeries = new ColumnSeries()
{
ItemsSource = new ViewModel().Data,
XBindingPath = "XValue",
YBindingPath = "YValue"
};
chart.Series.Add(columnSeries);
string filePath = System.IO.Directory.GetParent(@"../").FullName + "\\chart.xml";
chart.Serialize();Clone or copy the chart
More like serialization, you can use Clone method for SfChart control state persistence. This method creates a copy of the chart instance.
var chartCopy = chart.Clone() as SfChart;

grid.Children.Add(chartCopy as SfChart);

//Here, 'grid' is an empty container in the application to hold the chart.
TIPS
You can use this method for copy and paste like requirement, by cloning chart upon copy and reload while pasting.
Deferred real-time updates
You can hold and resume the series updates in dynamic update scenarios using the below methods.
Chart events
SfChart provides the following list of events.
SelectionChanging
The SelectionChanging event occurs before the data point is being selected. This is a cancelable event. This argument contains the following information.
-
SelectedSeries- Gets the series of the selected data point. -
SelectedSegments- Gets or sets the segments collection of the selected series. -
SelectedSegment- Gets the segment of the selected data point. -
SelectedIndex- Gets the selected data point index. -
PreviousSelectedIndex- Gets the previous selected data point index. -
IsSelected- Gets a value that indicates whether the segment or series is selected. -
IsDataPointSelection- Gets a value that indicates whether the selection is segment selection or series selection. -
Cancel- Gets or Sets a value that indicates whether the selection should be canceled.
SelectionChanged
The SelectionChanged event occurs after a data point has been selected. This argument contains the following information.
-
SelectedSeries- Gets the series of the selected data point. -
SelectedSegments- Gets the segments collection of the selected series. -
SelectedSegment- Gets the segment of the selected data point. -
SelectedIndex- Gets the selected data point index. -
PreviousSelectedSeries- Gets the previous selected series. -
PreviousSelectedSegments- Gets the segments collection of previous selected series. -
PreviousSelectedSegment- Gets the segment of previous selected data point. -
PreviousSelectedIndex- Gets the previous selected data point index. -
OldPointInfo- Gets the previous selected segment item value. -
NewPointInfo- Gets the selected segment item value. -
IsSelected- Gets a value that indicates whether the segment or series is being selected. -
IsDataPointSelection- Gets a value that indicates whether the selection is segment selection or series selection. -
SelectedSeriesCollection- Gets the series collection that has been selected through rectangle selection or mouse interaction.
ZoomChanging
The ZoomChanging event occurs when users start zooming the chart. This is a cancelable event. This argument contains the following information.
-
Axis- Gets an instance of the axis whose range is changed through zooming. This event is triggered for each axis in the chart. -
Cancel- Gets or Sets a value that indicates whether the zooming should be canceled. -
CurrentFactor- Gets the current zoom factor of the axis. -
CurrentPosition- Gets the current zoom position of the axis. -
OldRange- Gets the old visible range of the axis. -
PreviousFactor- Gets the previous zoom factor of the axis. -
PreviousPosition- Gets the previous zoom position of the axis.
ZoomChanged
The ZoomChanged event occurs after the zooming has been completed. This argument contains the following information.
-
Axis- Gets an instance of the axis whose range is changed through zooming. This event is triggered for each axis in the chart. -
CurrentFactor- Gets the current zoom factor of the axis. -
CurrentPosition- Gets the current zoom position of the axis. -
OldRange- Gets the old visible range of the axis. -
NewRange- Gets the new visible range of the axis. -
PreviousFactor- Gets the previous zoom factor of the axis. -
PreviousPosition- Gets the previous zoom position of the axis.
SelectionZoomingStart
The SelectionZoomingStart event occurs when users start selection zooming. This argument contains the following information.
-
ZoomRect- Gets the initial bounds of the selected region.
SelectionZoomingEnd
The SelectionZoomingEnd event occurs after selection zooming ends. This argument contains the following information.
-
ZoomRect- Gets the final bounds of the selected region.
SelectionZoomingDelta
The SelectionZoomingDelta event occurs when selecting a region to be zoomed. This is a cancelable event. This argument contains the following information.
-
ZoomRect- Gets the final bounds of the selected region. -
Cancel- Gets or Sets a value that indicates whether the selection zooming should be canceled.
PanChanging
The PanChanging event occurs when users start panning the chart. This is a cancelable event. This argument contains the following information:
-
Axis- Gets an instance of the axis whose range is changed while panning. This event is triggered for each axis in the chart. -
Cancel- Gets or Sets a value that indicates whether the panning should be canceled. -
NewZoomPosition- Gets a new zoom position of the axis. -
OldZoomPosition- Gets the old zoom position of the axis.
PanChanged
The PanChanged event occurs when panning is completed. This argument contains the following information.
-
Axis- Gets an instance of the axis whose range is changed while panning. This event is triggered for each axis in the chart. -
NewZoomPosition- Gets a new zoom position of the axis.
ResetZooming
The ResetZooming event occurs when resetting the chart on double tap. This is a cancelable event. This argument contains the following information.
-
Axis- Gets an instance of the axis whose range is changed when panning. This event is triggered for each axis in the chart. -
Cancel- Gets or Sets a value that indicates whether the panning should be canceled. -
PreviousZoomRange- Gets the previous visible range of the axis.
See also