How can I help you?
Getting Started with TypeScript TreeMap
- This section explains briefly about how to create a TreeMap in your application with TypeScript.
- Here you can learn how to configure a TreeMap control in a real-time scenario where it is used to visually represent the percentage of growth in population in each continent.
- It also provides a walk-through on some of the customization features available in TreeMap control.
Create a TreeMap
You can easily create the TreeMap widget by using the following steps.
Add Libraries
1.First create an TypeScript Project and add the following script reference in the app.ts page
For common getting started of TypeScript , you can refer here.
The default type definition file ej.web.all.d.ts needs to include the support for type-checking while initializing any of the Syncfusion widgets.
The important step you need to do is to copy the ej.web.all.d.ts file into your project and then need to refer it in your TypeScript application (app.ts file), so that you will get the intelliSense support and also the compile time type-checking.
You can find the ej.web.all.d.ts file in the following location,
(installed location)\Syncfusion\Essential Studio\33.1.44\JavaScript\assets\typescript
Apart from ej.web.all.d.ts file, it is also necessary to make use of the jquery.d.ts file in your TypeScript application, which can be downloaded from here.
2.Add the following script reference in the HTML page
<!DOCTYPE html>
<html>
<head>
        <link href="http://cdn.syncfusion.com/33.1.44/js/web/bootstrap-theme/ej.web.all.min.css" rel="stylesheet" />
        <script src="https://code.jquery.com/jquery-3.0.0.min.js"></script>
        <script src="http://cdn.syncfusion.com/33.1.44/js/web/ej.web.all.min.js" type="text/javascript"></script>
        <script src="http://cdn.jsdelivr.net/jsrender/1.0pre35/jsrender.min.js" type="text/javascript"></script>
        <script src="app.js"></script>
</head>
<body>
</body>
</html>
In the above code, ej.web.all.min.js script reference has been added for demonstration purpose. It is not recommended to use this for deployment purpose, as its file size is larger since it contains all the widgets. Instead, you can use [CSG](https://csg.syncfusion.com/ “”) utility to generate a custom script file with the required widgets for deployment purpose.
Initialize TreeMap
1.Create a <div> tag with specific id
<html> <body> <div id="TreeMap"></div> </body> </html>2.The dataSource property of the TreeMap accepts the collection values as input.Populate the datasource of the TreeMap data as JSON object. For example, you can use population data of countries to generate TreeMap data as illustrated in the following code sample.
var population_data = [
                   { Continent: "Asia", Region: "Southern Asia", Growth: 1.32, Population: 1749046000 },
                   { Continent: "Asia", Region: "Eastern Asia", Growth: 0.57, Population: 1620807000 },
                   { Continent: "Asia", Region: "South-Eastern Asia", Growth: 1.20, Population: 618793000 },
                   { Continent: "Asia", Region: "Western Asia", Growth: 1.98, Population: 245707000 },
                   { Continent: "Asia", Region: "Central Asia", Growth: 1.43, Population: 64370000 },
                   { Continent: "Europe", Region: "Europe", Growth: 0.10, Population: 742452000 },
                   { Continent: "America", Region: "South America", Growth: 1.06, Population: 406740000 },
                   { Continent: "America", Region: "Northern America", Growth: 0.85, Population: 355361000 },
                   { Continent: "America", Region: "Central America", Growth: 1.40, Population: 167387000 },
                   { Continent: "Africa", Region: "Eastern Africa", Growth: 2.89, Population: 373202000 },
                   { Continent: "Africa", Region: "Western Africa", Growth: 2.78, Population: 331255000 },
                   { Continent: "Africa", Region: "Northern Africa", Growth: 1.70, Population: 210002000 },
                   { Continent: "Africa", Region: "Middle Africa", Growth: 2.79, Population: 135750000 },
                   { Continent: "Africa", Region: "Southern Africa", Growth: 0.91, Population: 60425000 }
        ];
NOTE
Population data is referred from List of continents by population
3.The size of an object can be calculated by using the WeightValuePath of TreeMap
4.Initialize the TreeMap in ts file by using the ej.TreeMap method.
/// <reference path="tsfiles/jquery.d.ts" />
/// <reference path="tsfiles/ej.web.all.d.ts" />
module TreeMapComponent {
    $(function () {
        var treeMapSample = new ej.datavisualization.TreeMap($("#TreeMap"),{
                dataSource: population_data,
                weightValuePath: "Population",

        });
    });
}
The following image displays a TreeMap with default properties using the above code.

GroupTreeMap Items using Levels
You can group TreeMap Items using levels in TreeMap.
Group Path
You can use groupPath property for every flat level of the TreeMap control. It is a path to a field on the source object that serves as the “Group” for the level specified. You can group the data based on the groupPath in the TreeMap control. When the groupPath is not specified, then the items are not grouped and the data is displayed in the order specified in the dataSource.
Group Gap
You can use groupGap property to separate the items from every flat level and to differentiate the levels mentioned in the TreeMap control.
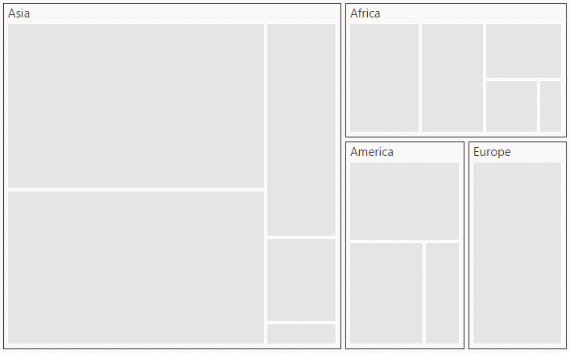
The following code sample explains how to group TreeMap Items using ‘Levels’
$(function () {
        var treeMapSample = new ej.datavisualization.TreeMap($("#TreeMap"),{
                dataSource: population_data,
                weightValuePath: "Population",
                levels: [
                     { groupPath: "Continent", groupGap: 5}
                   ]
        });
    });
The following screenshot displays grouping of TreeMapItems using Levels.
Customize TreeMap Appearance by Range
You can differentiate the nodes based on its value and color ranges using Range color. You can also define the color value range using From and To properties.
Color Value Path
The colorValuePath of TreeMap is a path to a field on the source object. You can determine the color for the object using colorValuePath of TreeMap.
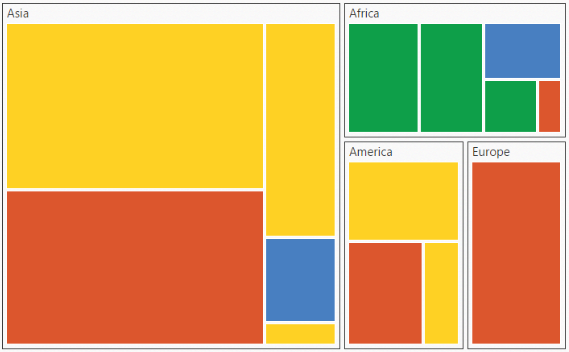
The following code sample explains how to customize TreeMap Appearance by Range.
$(function () {
        var treeMapSample = new ej.datavisualization.TreeMap($("#TreeMap"),{
                dataSource: population_data,
                weightValuePath: "Population",
                levels: [
                    { groupPath: "Continent", groupGap: 5 }
                ],
                colorValuePath: "Growth",
                rangeColorMapping: [
                    { color: "#DC562D", from: "0", to: "1" },
                    { color: "#FED124", from: "1", to: "1.5" },
                    { color: "#487FC1", from: "1.5", to: "2" },
                    { color: "#0E9F49", from: "2", to: "3" }
                ]
        });
    });
The following screenshot displays customized TreeMap Appearance by Range
Enable Tooltip
You can enable the tooltip by setting showTooltip property to ‘true’. By default, it takes the property of the bound object that is referred in the weightValuePath and displays its content when the corresponding node is hovered. You can customize the template for tooltip using tooltipTemplate property.
Leaf Item Settings
You can customize the Leaf level TreeMap items using leafItemSettings. The Label and tooltip values take the property of bound object that is referred in the labelPath when defined.
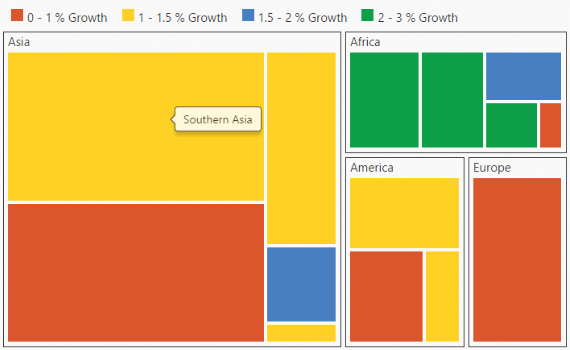
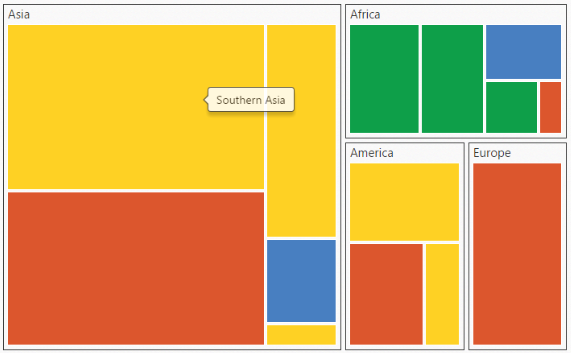
The following code sample displays how the tooltip is enabled.
$(function () {
        var treeMapSample = new ej.datavisualization.TreeMap($("#TreeMap"),{
                dataSource: population_data,
                weightValuePath: "Population",
                levels: [
                     { groupPath: "Continent", groupGap: 5}
                   ],
                colorValuePath: "Growth",
                rangeColorMapping: [
                      { color: "#DC562D", from: "0", to: "1" },
                      { color: "#FED124", from: "1", to: "1.5" },
                      { color: "#487FC1", from: "1.5", to: "2" },
                      { color: "#0E9F49", from: "2", to: "3" }
                ],
                showTooltip:true,
                leafItemSettings: { labelPath: "Region" }
        });
    });
The following screenshot displays the TreeMap when the Tooltip is enabled.
Legend
You can set the color value of leaf nodes using TreeMap Legend. This legend is appropriate only for the TreeMap whose leaf nodes are colored using rangeColorMapping.
You can set ShowLegend property value to ‘true’ to make a Legend visible.
Label for Legend
You can customize the labels of the legend item using legendLabel property of rangeColorMapping.
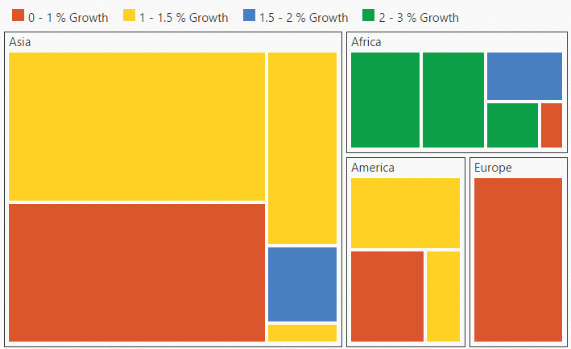
The following code sample displays how to add labels for legend in a TreeMap.
$(function () {
        var treeMapSample = new ej.datavisualization.TreeMap($("#TreeMap"),{
                  dataSource: population_data,
                weightValuePath: "Population",
                levels: [
                     { groupPath: "Continent", groupGap: 5}
                   ],
                colorValuePath: "Growth",
                rangeColorMapping: [
                  { color: "#DC562D", from: "0", to: "1", **legendLabel: "0 - 1 %    Growth"** },
                  { color: "#FED124", from: "1", to: "1.5", **legendLabel: "1 - 1.5 % Growth"** },
                  { color: "#487FC1", from: "1.5", to: "2", **legendLabel: "1.5 - 2 % Growth"** },
                  { color: "#0E9F49", from: "2", to: "3", **legendLabel: "2 - 3 % Growth"** }
                ],
                showTooltip:true,
                leafItemSettings: { labelPath: "Region" },
                showLegend: true,
                legendSettings: {
                  showLegend:true,
                  height:38,
                  width:690,
                }
        });
    });
The following screenshot displays the TreeMap when Labels are enabled.