Getting Started
7 Dec 201712 minutes to read
This section explains you the steps required to populate the RangeNavigator with data, add data labels, tooltips and title to the Chart. This section covers only the minimal features that you need to know to get started with the RangeNavigator.
Create your RangeNavigator
This section encompasses on how to configure the ejRangeNavigator and update the chart control for RangeNavigator’s selected range. It also helps you to learn how to pass the required data to RangeNavigator and customize the scale and selected range for your requirements. In this example, you will look at the steps to configure a RangeNavigator to analyze sales of a product for a particular quarter in a year.
Configure ejRangeNavigator
Getting started with your ejRangeNavigator is simple. You can initialize the ejRangeNavigator by setting its range values.
1.First create an TypeScript Project and the following script reference in the app.ts file
For common getting started of TypeScript , you can refer here.
The default type definition file ej.web.all.d.ts needs to include the support for type-checking while initializing any of the Syncfusion widgets.
The important step you need to do is to copy the ej.web.all.d.ts file into your project and then need to refer it in your TypeScript application (app.ts file), so that you will get the intelliSense support and also the compile time type-checking.
You can find the ej.web.all.d.ts file in the following location,
(installed location)\Syncfusion\Essential Studio\28.1.33\JavaScript\assets\typescript
Apart from ej.web.all.d.ts file, it is also necessary to make use of the jquery.d.ts file in your TypeScript application, which can be downloaded from here.
2.Add the below script reference in the HTML page
<!DOCTYPE html>
<html>
<head>
        <link href="http://cdn.syncfusion.com/28.1.33/js/web/bootstrap-theme/ej.web.all.min.css" rel="stylesheet" />
        <script src="https://code.jquery.com/jquery-3.0.0.min.js"></script>
        <script src="http://cdn.syncfusion.com/28.1.33/js/web/ej.web.all.min.js" type="text/javascript"></script>
        <script src="app.js"></script>
</head>
<body>
</body>
</html>
In the above code, ej.web.all.min.js script reference has been added for demonstration purpose. It is not recommended to use this for deployment purpose, as its file size is larger since it contains all the widgets. Instead, you can use [CSG](http://csg.syncfusion.com/# “”) utility to generate a custom script file with the required widgets for deployment purpose.
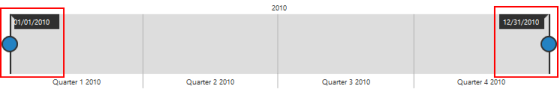
3.Create a <div> tag.
<html> <body> <div id="RangeNavigator"></div> </body> </html>4.Initialize the RangeNavigator in ts file by using the ej.RangeNavigator method.
/// <reference path="tsfiles/jquery.d.ts" />
/// <reference path="tsfiles/ej.web.all.d.ts" />
module RangeNavigatorComponent {
    $(function () {
        var rangeNavigatorSample = new ej.datavisualization.RangeNavigator($("#RangeNavigator"),{
            rangeSettings: {
                    start: "2010/1/1", end: "2010/12/31"
                },
        });
    });
}
The following Screen shot displays the RangeNavigator with a range from 2010 January 1st to December 31st.
Add series
To add a series to RangeNavigator, you need to set dataSource property, as given in the following code example.
You can create data source for RangeNavigator as follows.
var data = [{ "xDate": new Date(2011, 0, 1), "yValue": 10 },
                        { "xDate": new Date(2011, 2, 1), "yValue": 5 },
                        { "xDate": new Date(2011, 4, 1), "yValue": 15 },
                        { "xDate": new Date(2011, 6, 1), "yValue": 25 },
                        { "xDate": new Date(2011, 8, 1), "yValue": 10 },
                        { "xDate": new Date(2011, 10, 1), "yValue": 5 },
                        { "xDate": new Date(2011, 12, 1), "yValue": 15 }];
Now, add the dataSource to the RangeNavigator and provide the field name to get the values from the dataSource in xName and yName options
$(function () {
        var rangeNavigatorSample = new ej.datavisualization.RangeNavigator($("#RangeNavigator"),{
          series: [
                {
                     type: 'line',
                    dataSource: data, xName: "XValue", yName: "YValue",
                    }
            ]
        });
    });
The following screenshot displays the RangeNavigator with the type series as “line”.
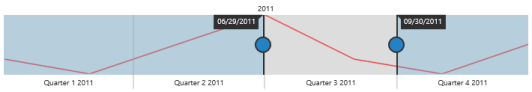
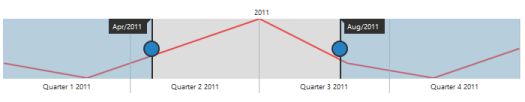
Enable tooltip
Tooltip can be customized for RangeNavigator using tooltip option. You can also use TooltipDisplayMode option in tooltip to display the tooltip “always” or “ondemand” (displays tooltip only while dragging the sliders). You can also specify label format for tooltip using LabelFormat.
$(function () {
        var rangeNavigatorSample = new ej.datavisualization.RangeNavigator($("#RangeNavigator"),{
           tooltipSettings: {
              visible: true, labelFormat: "MMM/yyyy", tooltipDisplayMode: "always"
            },
        });
    });
The following screen shot displays the label format Tooltip in RangeNavigator:
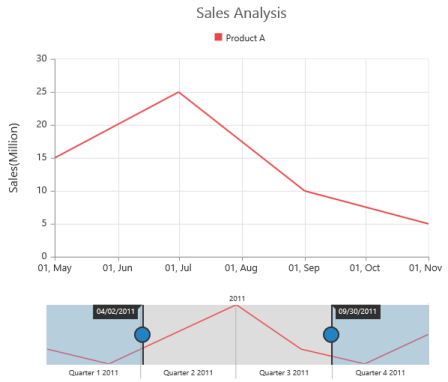
Update Chart
You can use ejRangeNavigator with controls such as chart and grid to view the range of data selected in ejRangeNavigator.
In order to update chart, whenever the selected range changes in ejRangeNavigator, you need to use rangeChanged event of ejRangeNavigator and then update the chart with the selected data in this event.
You can create a chart with line series using the following code sample.
Create a <div> tag with an id for rendering the chart.
<body>
<div id=" Chart "></div>
</body>$(function () {
var rangeNavigatorSample = new ej.datavisualization.RangeNavigator($("#RangeNavigator"),{
dataSource: data, xName: "XValue", yName: "YValue",
rangeChanged: function (sender) {
var chartObj = $("#Chart").data("ejChart");
if (chartObj != null) {
chartObj.model.series[0].dataSource = sender.selectedData;
$("#Chart").ejChart("redraw");
}
}
]
});
var chart = new ej.datavisualization.Chart($("#Chart"), {
title: { text: "Sales Analysis" },
legend: { visible: true, position: 'top' },
primaryYAxis: {
title: { text: "Sales(Million)" }
},
series: [
{
name: 'Product A', type: 'line',
dataSource: data, xName: "xDate", yName: "yValue"
}
],
});
});The following screenshot displays how the RangeNavigator is updated when the selected range is changed.

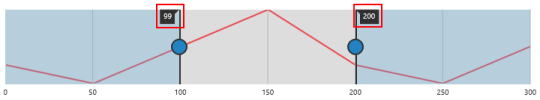
Set value type
RangeNavigator can also be used with numerical values. You can specify the data type using ValueType option.
First let’s create a DataSource for Chart Series with integer Values.
var Data = [
    { "xDate": 0, "yValue": 10 },
    { "xDate": 50, "yValue": 5 },
    { "xDate": 100, "yValue": 15 },
    { "xDate": 150, "yValue": 25 },
    { "xDate": 200, "yValue": 10 },
    { "xDate": 250, "yValue": 5 },
    { "xDate": 300, "yValue": 15 },
      ];
Now, you can set the dataSource for Chart Series and valueType property to “numeric” as given in the following code example.
$(function () {
        var rangeNavigatorSample = new ej.datavisualization.RangeNavigator($("#RangeNavigator"),{
          series: [
                {
                     type: 'line',
                    dataSource: data, xName: "XValue", yName: "YValue",
                    }
            ] ,
            valueType:"numeric"
        });
    });
The following screenshot displays the RangeNavigator with numerical values: