Getting Started
9 Mar 201822 minutes to read
This section explains you the steps required to populate the PivotGauge with data source. This section covers only the minimal features that you need to know to get started with the PivotGauge.
For common steps of typescript , you can refer here.
The default type definition file ej.web.all.d.ts needs to include the support for type-checking while initializing any of the Syncfusion widgets.
The important step you need to do is to copy the ej.web.all.d.ts file into your project and then need to refer it in your TypeScript application (app.ts file), so that you will get the intelliSense support and also the compile time type-checking.
You can find the ej.web.all.d.ts file in the following location,
(installed location)\Syncfusion\Essential Studio\24.2.3\JavaScript\assets\typescript
Apart from ej.web.all.d.ts file, it is also necessary to make use of the jquery.d.ts file in your TypeScript application, which can be downloaded from here.
Script and CSS Reference
Add the scripts and CSS references to the “index.html” page as the order mentioned in the following code example.
<!DOCTYPE html>
<html>
<head>
    <link href="http://cdn.syncfusion.com/24.2.3/js/web/bootstrap-theme/ej.web.all.min.css" rel="stylesheet" />
    <script src="https://code.jquery.com/jquery-3.0.0.min.js"></script>
    <script src="http://cdn.syncfusion.com/js/assets/external/jsrender.min.js" type="text/javascript"></script>
    <script src="https://ajax.aspnetcdn.com/ajax/jquery.validate/1.14.0/jquery.validate.min.js"></script>
    <script src="http://cdn.syncfusion.com/24.2.3/js/web/ej.web.all.min.js" type="text/javascript"></script>
    <script src="app.js"></script>
</head>
<body>
</body>
</html>
In the above code, ej.web.all.min.js script reference has been added for demonstration purpose. It is not recommended to use this for deployment purpose, as its file size is larger since it contains all the widgets. Instead, you can use [CSG](http://csg.syncfusion.com/# “”) utility to generate a custom script file with the required widgets for deployment purpose.
Relational
This section covers the information that you need to know to populate a simple PivotGauge with Relational data source.
Control Initialization
Add a div container to render the PivotGauge.
<!DOCTYPE html>
<html>
     <body>
         <div id="PivotGauge1"></div>
     </body>
</html>
Initialize the PivotGauge in app.ts file by using the ej.PivotGauge method.
/// <reference path="jquery.d.ts" />
/// <reference path="ej.web.all.d.ts" />

$(function () {
    var sample = new ej.PivotGauge($("#PivotGauge1"), { });
});
Populate PivotGauge with Data
Let us now see how to populate the PivotGauge control using a sample JSON data as shown below.
/// <reference path="jquery.d.ts" />
/// <reference path="ej.web.all.d.ts" />
var pivot_dataset = [
{ Amount: 100, Country: "Canada", Date: "FY 2005", Product: "Bike", Quantity: 2, State: "Alberta" },
{ Amount: 200, Country: "Canada", Date: "FY 2006", Product: "Van", Quantity: 3, State: "British Columbia" },
{ Amount: 300, Country: "Canada", Date: "FY 2007", Product: "Car", Quantity: 4, State: "Brunswick" },
{ Amount: 150, Country: "Canada", Date: "FY 2008", Product: "Bike", Quantity: 3, State: "Manitoba" },
{ Amount: 200, Country: "Canada", Date: "FY 2006", Product: "Car", Quantity: 4, State: "Ontario" },
{ Amount: 100, Country: "Canada", Date: "FY 2007", Product: "Van", Quantity: 1, State: "Quebec" },
{ Amount: 200, Country: "France", Date: "FY 2005", Product: "Bike", Quantity: 2, State: "Charente-Maritime" },
{ Amount: 250, Country: "France", Date: "FY 2006", Product: "Van", Quantity: 4, State: "Essonne" },
{ Amount: 300, Country: "France", Date: "FY 2007", Product: "Car", Quantity: 3, State: "Garonne (Haute)" },
{ Amount: 150, Country: "France", Date: "FY 2008", Product: "Van", Quantity: 2, State: "Gers" },
{ Amount: 200, Country: "Germany", Date: "FY 2006", Product: "Van", Quantity: 3, State: "Bayern" },
{ Amount: 250, Country: "Germany", Date: "FY 2007", Product: "Car", Quantity: 3, State: "Brandenburg" },
{ Amount: 150, Country: "Germany", Date: "FY 2008", Product: "Car", Quantity: 4, State: "Hamburg" },
{ Amount: 200, Country: "Germany", Date: "FY 2008", Product: "Bike", Quantity: 4, State: "Hessen" },
{ Amount: 150, Country: "Germany", Date: "FY 2007", Product: "Van", Quantity: 3, State: "Nordrhein-Westfalen" },
{ Amount: 100, Country: "Germany", Date: "FY 2005", Product: "Bike", Quantity: 2, State: "Saarland" },
{ Amount: 150, Country: "United Kingdom", Date: "FY 2008", Product: "Bike", Quantity: 5, State: "England" },
{ Amount: 250, Country: "United States", Date: "FY 2007", Product: "Car", Quantity: 4, State: "Alabama" },
{ Amount: 200, Country: "United States", Date: "FY 2005", Product: "Van", Quantity: 4, State: "California" },
{ Amount: 100, Country: "United States", Date: "FY 2006", Product: "Bike", Quantity: 2, State: "Colorado" },
{ Amount: 150, Country: "United States", Date: "FY 2008", Product: "Car", Quantity: 3, State: "New Mexico" },
{ Amount: 200, Country: "United States", Date: "FY 2005", Product: "Bike", Quantity: 4, State: "New York" },
{ Amount: 250, Country: "United States", Date: "FY 2008", Product: "Car", Quantity: 3, State: "North Carolina" },
{ Amount: 300, Country: "United States", Date: "FY 2007", Product: "Van", Quantity: 4, State: "South Carolina" }
];
$(function () {
var sample = new ej.PivotGauge($("#PivotGauge1"), {
dataSource: {
data: pivot_dataset,
rows: [
{
fieldName: "Country"
},
{
fieldName: "State"
}
],
columns: [
{
fieldName: "Product"
}
],
values: [
{
fieldName: "Amount",
fieldCaption: "Amount"
},
{
fieldName: "Quantity",
fieldCaption: "Quantity"
}
]
},
enableTooltip: true, isResponsive: true,
labelFormatSettings: { decimalPlaces: 2 },
scales: [{
showRanges: true,
radius: 150, showScaleBar: true, size: 1,
border: {
width: 0.5
},
showIndicators: true, showLabels: true,
pointers: [{
showBackNeedle: true,
backNeedleLength: 20,
length: 120,
width: 7
},
{
type: "marker",
markerType: "diamond",
distanceFromScale: 5,
placement: "center",
backgroundColor: "#29A4D9",
length: 25,
width: 15
}],
ticks: [{
type: "major",
distanceFromScale: 2,
height: 16,
width: 1, color: "#8c8c8c"
},
{
type: "minor",
height: 6,
width: 1,
distanceFromScale: 2,
color: "#8c8c8c"
}],
labels: [{
color: "#8c8c8c"
}],
ranges: [{
distanceFromScale: -5,
backgroundColor: "#fc0606",
border: { color: "#fc0606" }
},
{
distanceFromScale: -5
}],
customLabels: [{
position: { x: 180, y: 290 },
font: { size: "10px", fontFamily: "Segoe UI", fontStyle: "Normal" }, color: "#666666"
},
{
position: { x: 180, y: 320 },
font: { size: "10px", fontFamily: "Segoe UI", fontStyle: "Normal" }, color: "#666666"
},
{
position: { x: 180, y: 150 },
font: { size: "12px", fontFamily: "Segoe UI", fontStyle: "Normal" }, color: "#666666"
}]
}]
});
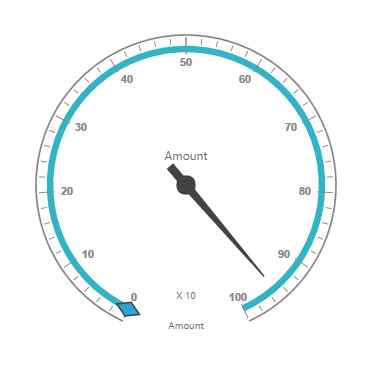
});The above code will generate a simple PivotGauge as shown in below figure.
OLAP
This section covers the information that you need to know to populate a simple PivotGauge with OLAP data source.
Control Initialization
Add a div container to render the PivotGauge.
<!DOCTYPE html>
<html>
     <body>
         <div id="PivotGauge1"></div>
     </body>
</html>
Initialize the PivotGauge in ts file by using the ej.PivotGauge method.
/// <reference path="jquery.d.ts" />
/// <reference path="ej.web.all.d.ts" />

$(function () {
    var sample = new ej.PivotGauge($("#PivotGauge1"), { });
});
Populate PivotGauge with data
Let us now see how to populate the PivotGauge control using a sample JSON data as shown below.
/// <reference path="jquery.d.ts" />
/// <reference path="ej.web.all.d.ts" />
$(function () {
var sample = new ej.PivotGauge($("#PivotGauge1"), {
dataSource: {
data: "http://bi.syncfusion.com/olap/msmdpump.dll",
catalog: "Adventure Works DW 2008 SE",
cube: "Adventure Works",
rows: [
{
fieldName: "[Date].[Fiscal]",
filterItems: { filterType: "include", values: ["[Date].[Fiscal].[Fiscal Year].&[2004]"] }
},
],
columns: [
{
fieldName: "[Customer].[Customer Geography]"
}
],
values: [
{
measures: [
{
fieldName: "[Measures].[Internet Sales Amount]"
},
{
fieldName: "[Measures].[Internet Revenue Status]"
},
{
fieldName: "[Measures].[Internet Revenue Trend]"
},
{
fieldName: "[Measures].[Internet Revenue Goal]"
},
],
axis: "columns"
}
],
filters: []
},
enableTooltip: true, isResponsive: true,
labelFormatSettings: { decimalPlaces: 2 },
scales: [{
showRanges: true,
radius: 150, showScaleBar: true, size: 1,
border: {
width: 0.5
},
showIndicators: true, showLabels: true,
pointers: [{
showBackNeedle: true,
backNeedleLength: 20,
length: 120,
width: 7
},
{
type: "marker",
markerType: "diamond",
distanceFromScale: 5,
placement: "center",
backgroundColor: "#29A4D9",
length: 25,
width: 15
}],
ticks: [{
type: "major",
distanceFromScale: 2,
height: 16,
width: 1, color: "#8c8c8c"
},
{
type: "minor",
height: 6,
width: 1,
distanceFromScale: 2,
color: "#8c8c8c"
}],
labels: [{
color: "#8c8c8c"
}],
ranges: [{
distanceFromScale: -5,
backgroundColor: "#fc0606",
border: { color: "#fc0606" }
},
{
distanceFromScale: -5
}],
customLabels: [{
position: { x: 180, y: 290 },
font: { size: "10px", fontFamily: "Segoe UI", fontStyle: "Normal" }, color: "#666666"
},
{
position: { x: 180, y: 320 },
font: { size: "10px", fontFamily: "Segoe UI", fontStyle: "Normal" }, color: "#666666"
},
{
position: { x: 180, y: 150 },
font: { size: "12px", fontFamily: "Segoe UI", fontStyle: "Normal" }, color: "#666666"
}]
}]
});
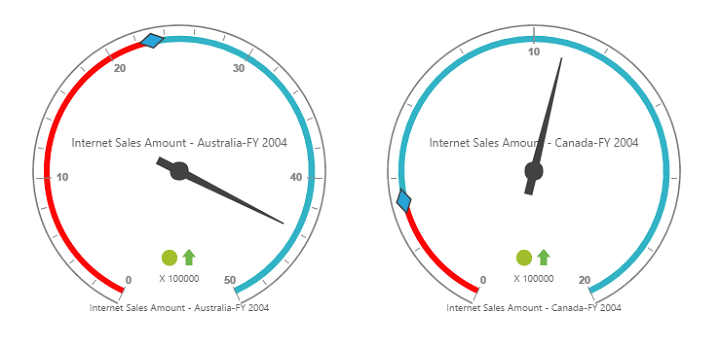
});The above code will generate a simple PivotGauge as shown in below figure.