Getting Started
8 Jun 202324 minutes to read
-
This section explains briefly about how to create Maps in your application with TypeScript
-
You can learn how to configure Map with simple steps. In this example, you can learn how to configure USA population map with customized appearance and tooltip.
Create a Map
You can easily create the Maps widget by using the following steps.
Add Libraries
1.First create an TypeScript Project and add the following references in the app.ts file
For common getting started of TypeScript , you can refer here.
The default type definition file ej.web.all.d.ts needs to include the support for type-checking while initializing any of the Syncfusion widgets.
The important step you need to do is to copy the ej.web.all.d.ts file into your project and then need to refer it in your TypeScript application (app.ts file), so that you will get the intelliSense support and also the compile time type-checking.
You can find the ej.web.all.d.ts file in the following location,
(installed location)\Syncfusion\Essential Studio\32.1.19\JavaScript\assets\typescript
Apart from ej.web.all.d.ts file, it is also necessary to make use of the jquery.d.ts file in your TypeScript application, which can be downloaded from here.
2.Add the following script reference in the HTML page
<!DOCTYPE html>
<html>
<head>
        <link href="http://cdn.syncfusion.com/32.1.19/js/web/bootstrap-theme/ej.web.all.min.css" rel="stylesheet" />
        <script src="https://code.jquery.com/jquery-3.0.0.min.js"></script>
        <script src="http://cdn.syncfusion.com/32.1.19/js/web/ej.web.all.min.js" type="text/javascript"></script>
        <script src="http://cdn.jsdelivr.net/jsrender/1.0pre35/jsrender.min.js" type="text/javascript"></script>
        <script src="app.js"></script>
</head>
<body>
</body>
</html>
In the above code, ej.web.all.min.js script reference has been added for demonstration purpose. It is not recommended to use this for deployment purpose, as its file size is larger since it contains all the widgets. Instead, you can use [CSG](http://csg.syncfusion.com/# “”) utility to generate a custom script file with the required widgets for deployment purpose.
Preparing Shape Data
The Shape Data collection describing geographical shape information can be obtained from GEOJSON format shapes.
In this example, USA shape is used as shape data by utilizing the United States of America.json file in the following folder structure obtained from downloaded Maps_GeoJSON folder.
..\ Maps_GeoJSON\All Countries with States
You can assign the complete contents in “United States of America.json” file to new JSON object. For your better understanding, a JS file “usa.js” is already created to store JSON data in JSON object “usMap”.
var usMap = //Paste all the content copied from the JSON file//Prepare Data Source
The datasource is populated with JSON data relative to shape data and stored in JSON object. USA population as datasource is used for better understanding.
The “populationData.js” file is used to store JSON data in JSON object “populationData”.
var populationData = [
        { name: "California", population: "38332521" },
        { name: "Texas", population: "26448193" },
        { name: "New York", population: "19651127" },
        { name: "Florida", population: "19552860" },
        { name: "Illinois", population: "12882135" },
        { name: "Pennsylvania", population: "12773801" },
        { name: "Ohio", population: "11570808" },
        { name: "Georgia", population: "9992167" },
        { name: "Michigan", population: "9895622" },
        { name: "North Carolina", population: "9848060" },
        { name: "New Jersey", population: "8899339" },
        { name: "Virginia", population: "8260405" },
        { name: "Washington", population: "6971406" },
        { name: "Massachusetts", population: "6692824" },
        { name: "Arizona", population: "6626624" },
        { name: "Indiana", population: "6570902" },
        { name: "Tennessee", population: "6495978" },
        { name: "Missouri", population: "6044171" },
        { name: "Maryland", population: "5928814" },
        { name: "Wisconsin", population: "5742713" },
        { name: "Minnesota", population: "5420380" },
        { name: "Colorado", population: "5268367" },
        { name: "Alabama", population: "4833722" },
        { name: "South Carolina", population: "4774839" },
        { name: "Louisiana", population: "4625470" },
        { name: "Kentucky", population: "4395295" },
        { name: "Oregon", population: "3930065" },
        { name: "Oklahoma", population: "3850568" },
        { name: "Puerto Rico", population: "3615086" },
        { name: "Connecticut", population: "3596080" },
        { name: "Iowa", population: "3090416" },
        { name: "Mississippi", population: "2991207" },
        { name: "Arkansas", population: "2959373" },
        { name: "Utah", population: "2900872" },
        { name: "Kansas", population: "2893957" },
        { name: "Nevada", population: "2790136" },
        { name: "New Mexico", population: "2085287" },
        { name: "Nebraska", population: "1868516" },
        { name: "West Virginia", population: "1854304" },
        { name: "Idaho", population: "1612136" },
        { name: "Hawaii", population: "1404054" },
        { name: "Maine", population: "1328302" },
        { name: "New Hampshire", population: "1323459" },
        { name: "Rhode Island", population: "1051511" },
        { name: "Montana", population: "1015165" },
        { name: "Delaware", population: "925749" },
        { name: "South Dakota", population: "844877" },
        { name: "Alaska", population: "735132" },
        { name: "North Dakota", population: "723393" },
        { name: "District of Columbia", population: "646449" },
        { name: "Vermont", population: "626630" },
        { name: "Wyoming", population: "582658" }
]
You can refer to shape data and datasource as illustrated in the HTML page,
<!-- Shape data file-->
    <script src="usa.js" type="text/javascript"></script>

    <!-- Data source file-->
    <script src="populationData.js" type="text/javascript"></script>
Initialize Map
1.Create a <div> tag and set the height and width to determine the map size.
<div id="Map" style="width: 900px; height: 600px;"></div>2.Initialize the Map in ts file by using the ej.Map method.
/// <reference path="tsfiles/jquery.d.ts" />
/// <reference path="tsfiles/ej.web.all.d.ts" />

module MapComponent {
    $(function () {
        var MapSample = new ej.datavisualization.Map($("#Map"));
      });
}
3.Add the shapeData property in the maps to render it in layers
module MapComponent {
$(function () {
var MapSample = new ej.datavisualization.Map($("#Map"),{
layers: [
{
shapeData: usMap
}]
});
});
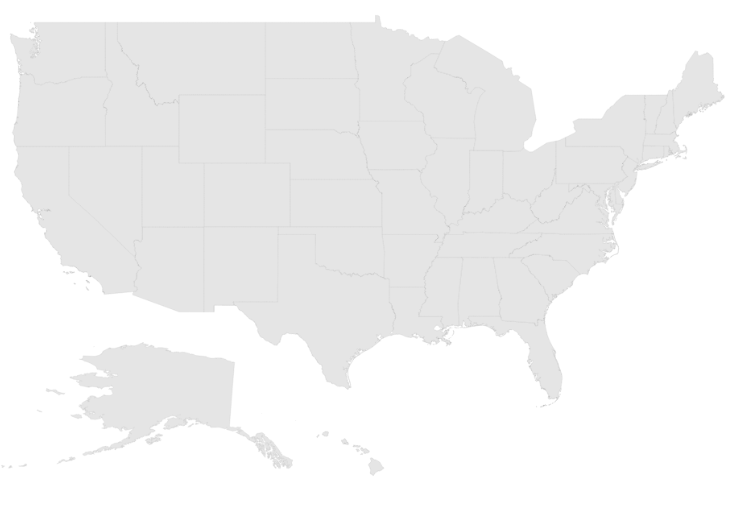
}The above code renders a map with default properties and shape input provided through data in layers.
Data Binding in Map
The following properties in shape layers is used for binding data in Maps control.
- DataSource
- ShapeDataPath
- ShapePropertyPath
DataSource
The dataSource property accepts collection values as input. For example, you can provide the list of objects as input.
Shape Data Path
The shapeDataPath property is used to refer the data ID in DataSource. For example, population MapData contains data ids ‘Name’ and ‘Population’. The shapeDataPath and shapePropertyPath properties are related to each other (refer to shapePropertyPath for more details).
Shape Property Path
The shapePropertyPath property is similar to the shapeDataPath that refers the column name in the Data property of shape layers to identify the shape. When the values of the shapeDataPath property in the dataSource property and the value of shapePropertyPath in the Data property match, then the associated object from the dataSource is bound to the corresponding shape.
$(function () {
var MapSample = new ej.datavisualization.Map($("#Map"),{
layers: [
{
shapeData: usMap,
shapeDataPath: "name",
shapePropertyPath: "name",
dataSource: populationData
}]
});
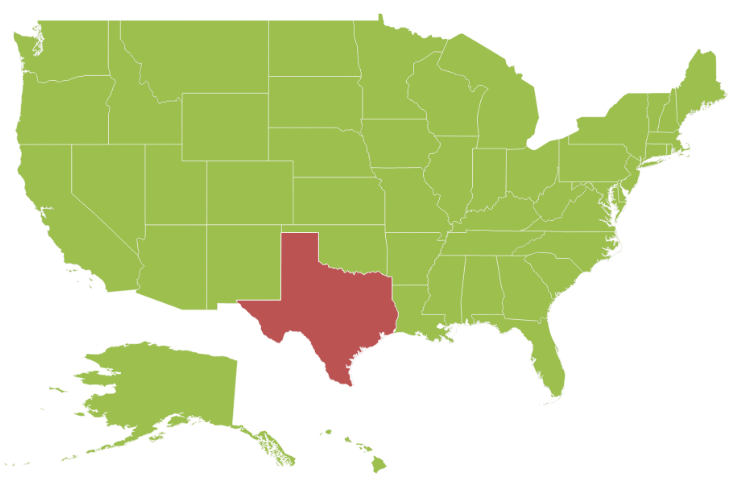
});Customize Map Appearance
You can customize the shape’s color by using fill, stroke and strokeThickness properties in shapeSettings.
$(function () {
        var MapSample = new ej.datavisualization.Map($("#Map"),{
            layers: [
                {
                   shapeData: usMap,
                    shapeDataPath: "name",
                    shapePropertyPath: "name",
                    dataSource: populationData,
                    enableSelection: false,
                    enableMouseHover: true,
                    shapeSettings: {
                        fill: "#9CBF4E",
                        strokeThickness: "0.5",
                        stroke: "White",
                        highlightStroke: "White",
                        highlightColor: "#BC5353",
                        highlightBorderWidth: "1"
                    }
                }]

        });
      });
Customizing Map Appearance by Range
The Range color mapping is used to differentiate the shape’s fill based on its underlying value and color ranges. The from and to properties defines the value ranges and the gradientColors property defines the equivalent color ranges respective to their value ranges.
NOTE
The
enableGradientproperty value should be true to apply gradient colors for maps.
$(function () {
var MapSample = new ej.datavisualization.Map($("#Map"),{
layers: [
{
shapeData: usMap,
shapeDataPath: "name",
shapePropertyPath: "name",
dataSource: populationData,
enableSelection: false,
enableMouseHover: true,
shapeSettings: {
fill: "#9CBF4E",
strokeThickness: "0.5",
stroke: "White",
highlightStroke: "White",
highlightColor: "#BC5353",
highlightBorderWidth: "1",
valuePath: "name",
colorValuePath: "population",
enableGradient: true,
colorMappings:
{
rangeColorMapping: [
{
from: 500000,
to: 1000000,
gradientColors: ["#9CBF4E", "#B8CE7B"]
},
{
from: 1000001,
to: 5000000,
gradientColors: ["#B8CE7B", "#CBD89A"]
},
{
from: 5000001,
to: 10000000,
gradientColors: ["#CBD89A", "#DEE2B9"]
},
{
from: 10000001,
to: 40000000,
gradientColors: ["#DEE2B9", "#F1ECD8"]
}
]
}
}
}]
});
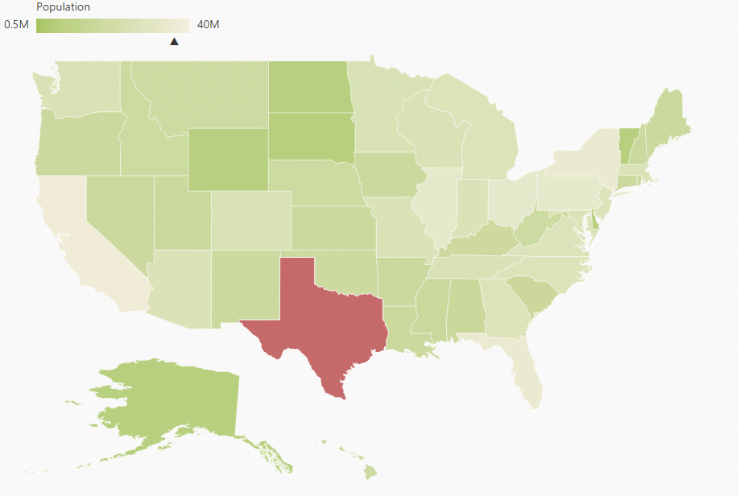
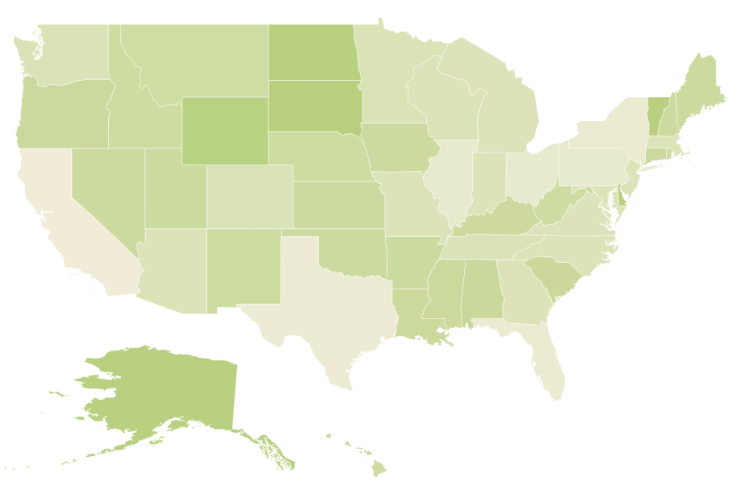
});The following screenshot illustrates a Map with gradient color property enable.
Enable Tooltip
The tooltip is displayed only when showTooltip is set to ‘true’ in the shape layers. By default, it takes the property of the bound object that is referred in the valuePath and displays its content on hovering the corresponding shape. The tooltipTemplate property is used for customizing the template for tooltip.
$(function () {
var MapSample = new ej.datavisualization.Map($("#Map"),{
layers: [
{
// ...
shapeSettings: {
// ...
valuePath: "name",
// ...
},
showTooltip: true
}]
});
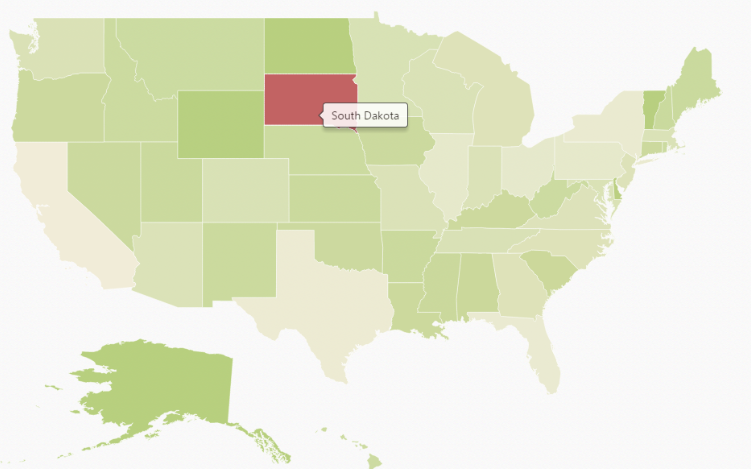
});The following screenshot illustrates a map control displaying a Tooltip.
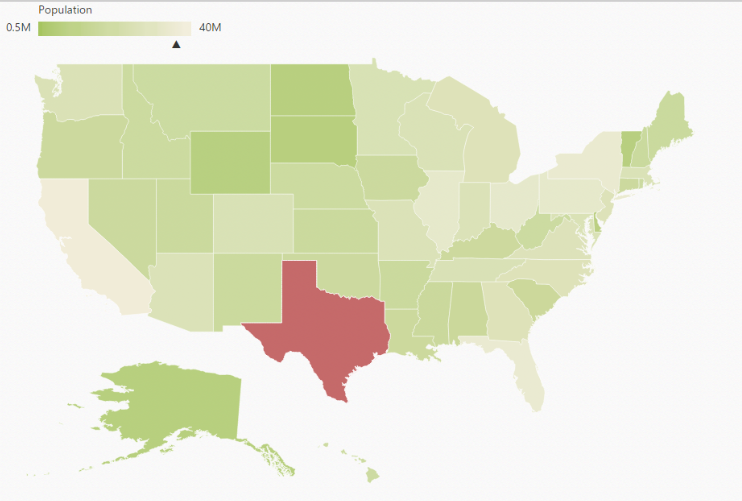
Legend
A Legend can be made visible by setting the showLegend property in legendSetting.
Interactive Legend
The legends can be made interactive with an arrow mark indicating the exact range color in the legend, when the mouse hovers the corresponding shapes. You can enable this option by setting mode property in legendSettings value as ‘Interactive’. The default value of mode property is ‘Default’ to enable the normal legend.
Title
Use title property to provide title for interactive legend.
Label
You can use leftLabel and rightLabel property to provide left and right labels for interactive legend.
$(function () {
        var MapSample = new ej.datavisualization.Map($("#Map"),{
            layers: [
                {
                     shapeData: usMap,
                    shapeDataPath: "name",
                    shapePropertyPath: "name",
                    dataSource: populationData,
                    enableSelection: false,
                    enableMouseHover: true,
                    shapeSettings: {
                        fill: "#9CBF4E",
                        strokeThickness: "0.5",
                        stroke: "White",
                        highlightStroke: "White",
                        highlightColor: "#BC5353",
                        highlightBorderWidth: "1",
                        valuePath: "population",
                        enableGradient: true,
                        colorMappings:
                        {
                            rangeColorMapping: [
                            {
                                from: 500000,
                                to: 1000000,
                                gradientColors: ["#9CBF4E", "#B8CE7B"]
                            },
                            {
                                from: 1000001,
                                to: 5000000,
                                gradientColors: ["#B8CE7B", "#CBD89A"]
                            },
                            {
                                from: 5000001,
                                to: 10000000,
                                gradientColors: ["#CBD89A", "#DEE2B9"]
                            },
                            {
                                from: 10000001,
                                to: 40000000,
                                gradientColors: ["#DEE2B9", "#F1ECD8"]
                            }]
                        }
                    },
                    legendSettings: {
                        showLegend:true,
						dockOnMap:true,
                        height:18,
                        width:190,
                        mode:"interactive",
                        title: "Population",
                        leftLabel: "0.5M",
                        rightLabel: "40M"
                    }
                }]

        });
      });
The following screenshot illustrates a map displaying an interactive legend.