Getting Started
7 Dec 201713 minutes to read
- This section encompasses the details on how to configure DigitalGauge. Here you will learn how to provide data for a DigitalGauge and display the data in the required way.
- In addition, you will learn how to customize the default DigitalGauge appearance according to your requirements. As a result, you will get a DigitalGauge that shows it as Digital thermometer.
- You can use this DigitalGauge in advertisements, decorative purposes, displaying share details in share market, game score boards, token systems, etc.
Digital Thermometer
Create a Digital Gauge
You can easily create the Digital Gauge widget by using the following steps.
1.First create an TypeScript Project and add the following references in the app.ts
For common getting started of TypeScript , you can refer here.
The default type definition file ej.web.all.d.ts needs to include the support for type-checking while initializing any of the Syncfusion widgets.
The important step you need to do is to copy the ej.web.all.d.ts file into your project and then need to refer it in your TypeScript application (app.ts file), so that you will get the intelliSense support and also the compile time type-checking.
You can find the ej.web.all.d.ts file in the following location,
(installed location)\Syncfusion\Essential Studio\24.2.3\JavaScript\assets\typescript
Apart from ej.web.all.d.ts file, it is also necessary to make use of the jquery.d.ts file in your TypeScript application, which can be downloaded from here.
2.Add the below script reference in the HTML page
<!DOCTYPE html>
<html>
<head>
        <link href="http://cdn.syncfusion.com/24.2.3/js/web/bootstrap-theme/ej.web.all.min.css" rel="stylesheet" />
        <script src="https://code.jquery.com/jquery-3.0.0.min.js"></script>
        <script src="http://cdn.syncfusion.com/24.2.3/js/web/ej.web.all.min.js" type="text/javascript"></script>
        <script src="app.js"></script>
</head>
<body>
</body>
</html>
In the above code, ej.web.all.min.js script reference has been added for demonstration purpose. It is not recommended to use this for deployment purpose, as its file size is larger since it contains all the widgets. Instead, you can use [CSG](http://csg.syncfusion.com/# “”) utility to generate a custom script file with the required widgets for deployment purpose.
3.Create a <div> tag.
<html> <body> <div id="DigitalGauge"></div> </body> </html>4.Initialize the DigitalGauge in ts file by using the ej.DigitalGauge method.
/// <reference path="tsfiles/jquery.d.ts" />
/// <reference path="tsfiles/ej.web.all.d.ts" />
module DigitalGaugeComponent {
    $(function () {
        var digitalGaugeSample = new ej.datavisualization.DigitalGauge($("#DigitalGauge"));
    });
}
Run the above code example and you will get a default Digital Gauge as follows.
Digital Gauge
Set Height and Width values
Basic attributes of each canvas elements are height and width. You can set the height and width of the gauge.
$(function () {
        var digitalGaugeSample = new ej.datavisualization.DigitalGauge($("#DigitalGauge"),{
            height: 145,
            width: 260,

        });
    });
Run the above code example and you will see a default gauge with the specified height and width values.
Digital Gauge with Height and Width
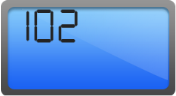
Set Items Property
Items have different properties to customize the Digital Gauge.
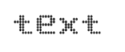
Add Segment and Character Properties
- In the Welcome Board, the text color must be attentive in nature. You can give some segment properties such as segment spacing, segment width, segment color, segment length and segment opacity.
- Character type is to define the Digital representation of the character. The five types of character representation available are,
- EightCrossEightDotMatrix
- SevenSegment
- FourteenSegment
- SixteenSegment
- EightCrossEightSquareMatrix.
$(function () {
        var digitalGaugeSample = new ej.datavisualization.DigitalGauge($("#DigitalGauge"),{
            height: 145,
            width: 260,
            items: [{
                segmentSettings: { width: 2, length: 20 },
                characterSettings: { type: "SevenSegment", spacing: 12, },
                value: "102",
            }]
        });
    });
Run the above code example and you will see the following output.

Digital Gauge Segment Properties
Add Background Image
- Add a <div> element to set the background for the Digital Gauge.
- Add a style tag in the View page to add the background image for the Digital Gauge.
- Add the required properties to show the background image such as position, margin, display, etc.,
<div id="frameDiv">
<div id="DigitalGauge" style="width:100%"></div>
</div>
<style>
#frameDiv {
align : center;
position : relative;
margin : 0px auto;
display :table;
background-image :url("script/frame.png");
background-repeat :no-repeat;
}
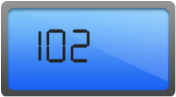
</style>Run the above code example and you will see the following output.
Digital Gauge Background Image
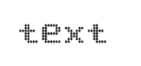
Add Location
The Location property is used to position the digital letters inside the canvas element.
$(function () {
        var digitalGaugeSample = new ej.datavisualization.DigitalGauge($("#DigitalGauge"),{
             height: 145,
            width: 260,
            items: [{
                //For Displaying Fahrenheit value
                segmentSettings: { width: 2, length: 20 },
                characterSettings: { type: "SevenSegment", spacing: 12, },
                value: "102", position: { x: 15, y: 40 }
                ]}
        });
    });
Run the above code example and you will see the following output.
Digital Gauge with Segment Location
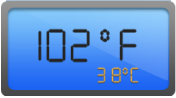
Add Items Collection
You can further add the Items Collection to display the temperature value like Digital Thermometer.
$(function () {
        var digitalGaugeSample = new ej.datavisualization.DigitalGauge($("#DigitalGauge"),{
            height: 145, width: 260,
            items: [{
                //For Displaying Fahrenheit value
                segmentSettings: { width: 2, length: 20, spacing: 0 },
                characterSettings: { type: "SevenSegment", spacing: 12, },
                value: "102",
                position: { x: 15, y: 40 }
            },
            {
                //For displaying degree symbol
                segmentSettings: { width: 2, length: 5, spacing: 0 },
                characterSettings: { type: "SevenSegment", spacing: 5, },
                value: "0",
                position: { x: 70, y: 28 }
            },
            {
                //For displaying Fahrenheit symbol
                segmentSettings: { width: 2, length: 20, spacing: 0 },
                characterSettings: { type: "SevenSegment", spacing: 12, },
                value: "F",
                position: { x: 170, y: 40 }
            },
            {
                //For displaying Celcius value
                segmentSettings: { width: 1, length: 9, spacing: 0, color: "#F5b43f" },
                characterSettings: { type: "SevenSegment", spacing: 12, },
                value: "38",
                position: { x: 70, y: 90 },
            },
            {
                //For displaying degree symbol
                segmentSettings: { width: 1, length: 3, spacing: 0, color: "#F5b43f" },
                characterSettings: { type: "SevenSegment", spacing: 12, },
                value: "0",
                position: { x: 90, y: 80 }
            },
            {
                //For displaying celcius symbol
                segmentSettings: { width: 1, length: 9, spacing: 0, color: "#F5b43f" },
                characterSettings: { type: "SevenSegment", spacing: 12, },
                value: "c",
                position: { x: 120, y: 90 }
            }]
        });
    });
Run the above code example and you will see the following output.
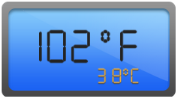
Digital Gauge with Item Collection