Timeline Header Rows in ASP.NET Core Scheduler
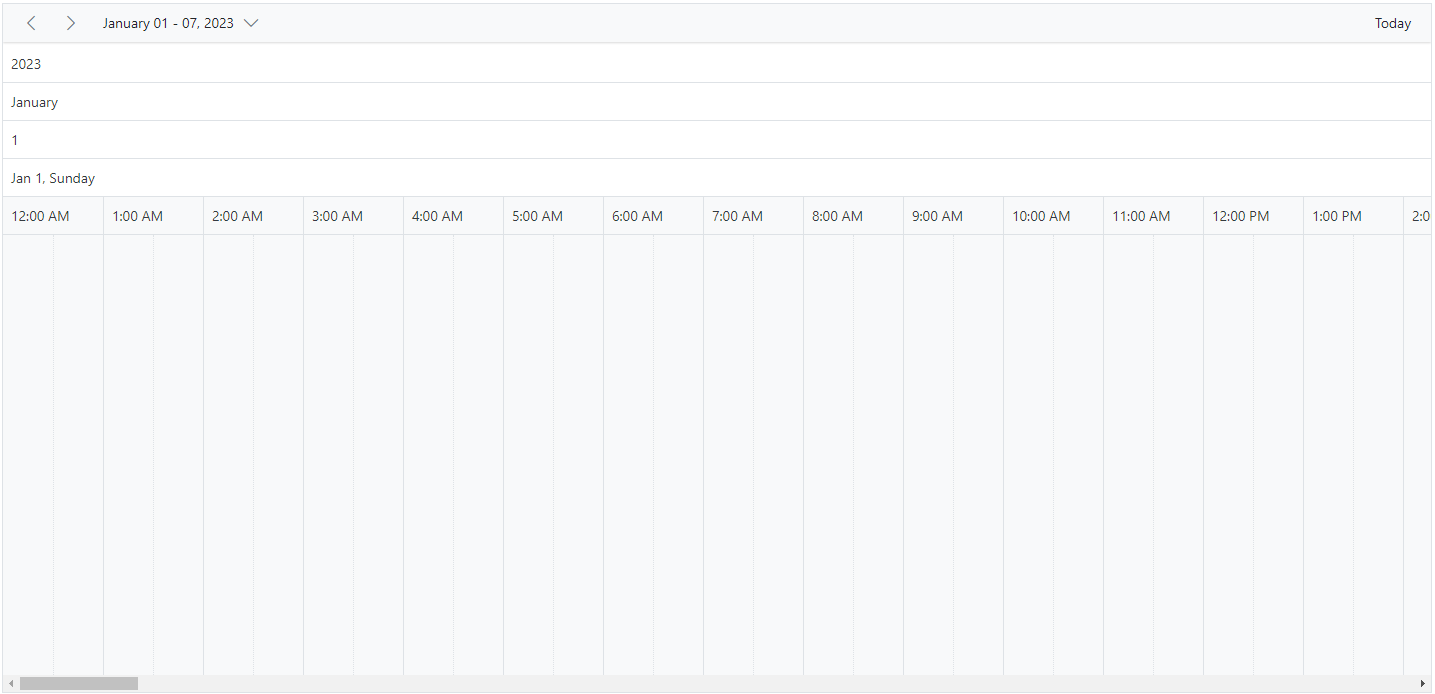
The Timeline views can have additional header rows other than the default date and time header rows. It is possible to show individual header rows for displaying year, month, and week separately by using the headerRows property. This property is applicable only to timeline views. The possible rows that can be added by using the headerRows property are as follows.
YearMonthWeekDateHour
The
Hourrow is not applicable to the TimelineMonth view.
The following example shows the Scheduler displaying all the available header rows on timeline views.
@using Syncfusion.EJ2.Schedule

<ejs-schedule id="schedule" width="100%" height="650px" selectedDate="new DateTime(2023, 1, 1)" >
    <e-schedule-header-rows>
        <e-schedule-header-row option="Year"></e-schedule-header-row>
        <e-schedule-header-row option="Month"></e-schedule-header-row>
        <e-schedule-header-row option="Week"></e-schedule-header-row>
        <e-schedule-header-row option="Date"></e-schedule-header-row>
        <e-schedule-header-row option="Hour"></e-schedule-header-row>
    </e-schedule-header-rows>
    <e-schedule-views>
        <e-schedule-view option="TimelineWeek" ></e-schedule-view>
    </e-schedule-views>
</ejs-schedule>
public ActionResult Index()
{
return View();
}
Display year and month rows in timeline views
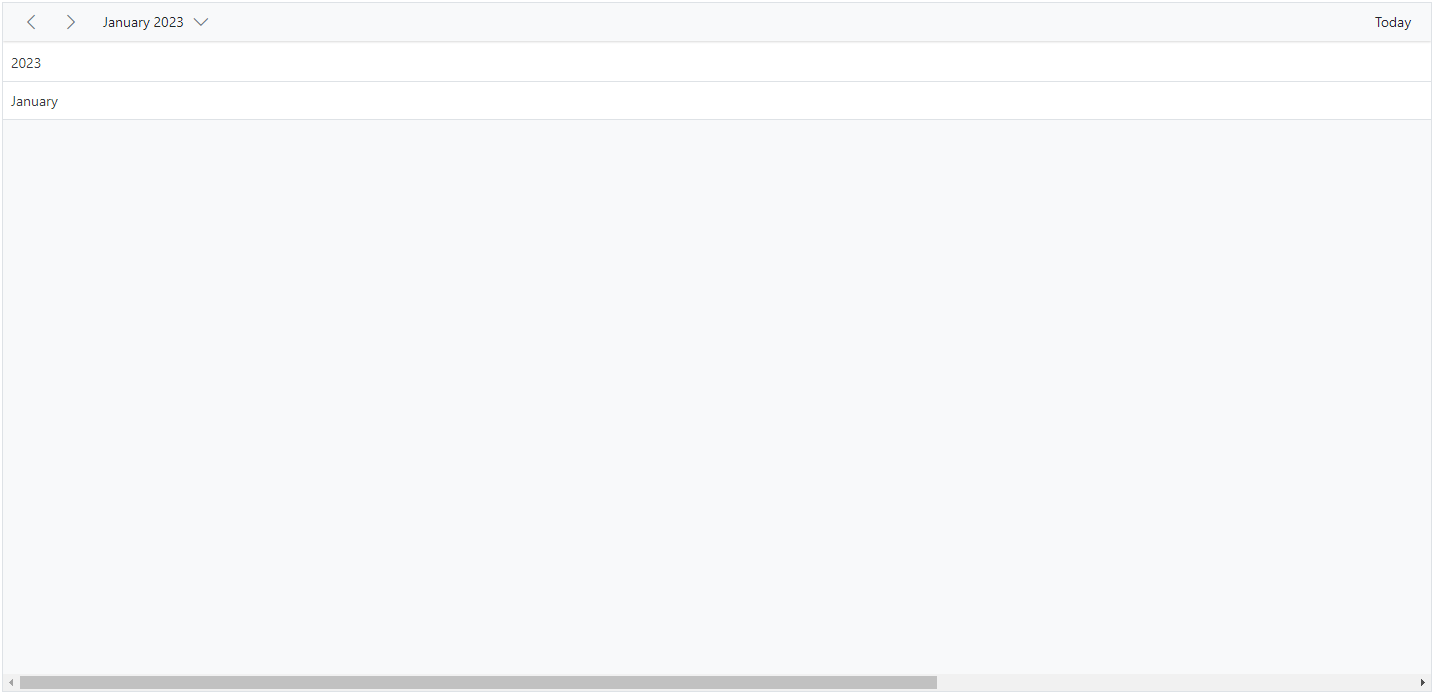
To display the Scheduler timeline with year and month names alone, define the Year and Month options within the headerRows property.
@using Syncfusion.EJ2.Schedule

<ejs-schedule id="schedule" width="100%" height="650px">
    <e-schedule-header-rows>
        <e-schedule-header-row option="Year"></e-schedule-header-row>
        <e-schedule-header-row option="Month"></e-schedule-header-row>
    </e-schedule-header-rows>
    <e-schedule-views>
        <e-schedule-view option="TimelineMonth" ></e-schedule-view>
    </e-schedule-views>
</ejs-schedule>
public ActionResult Index()
{
return View();
}
Display week numbers in timeline views
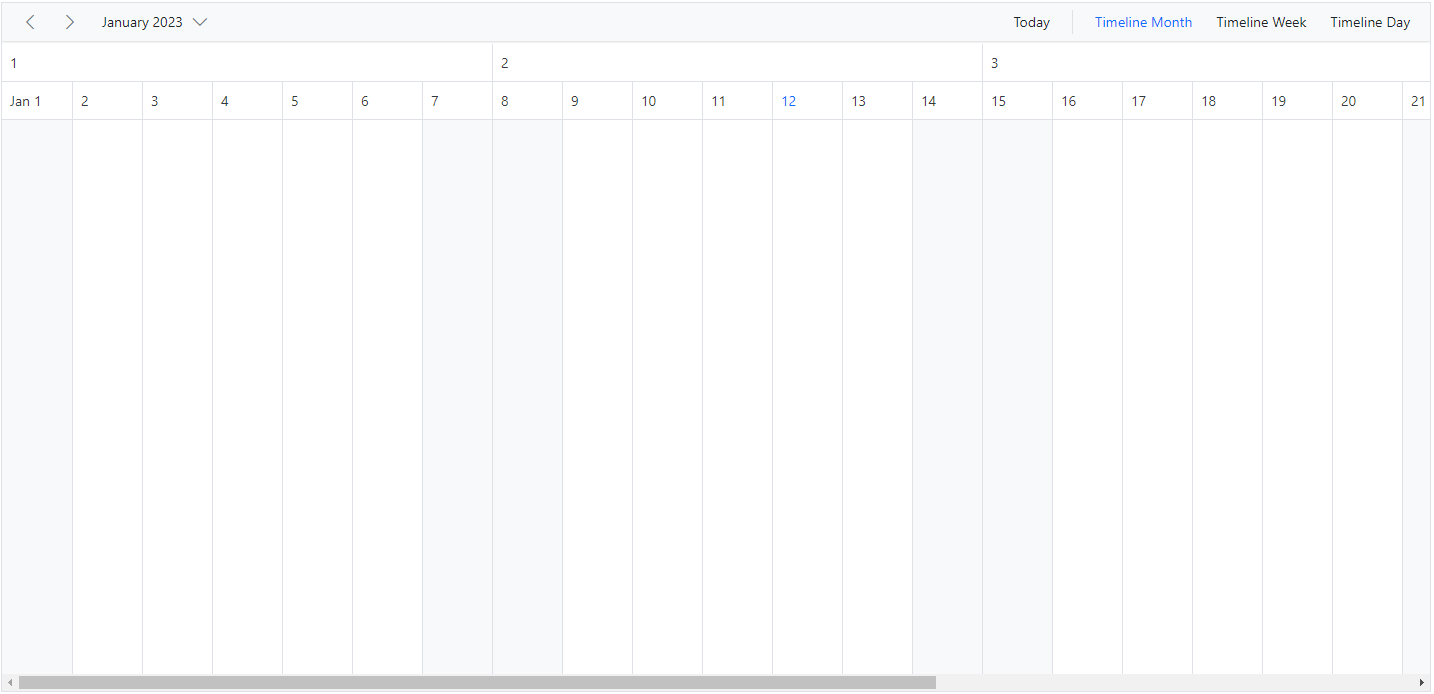
The week number can be displayed in a separate header row of the timeline Scheduler by setting Week option within headerRows property.
@using Syncfusion.EJ2.Schedule

<ejs-schedule id="schedule" width="100%" height="650px">
    <e-schedule-header-rows>
        <e-schedule-header-row option="Week"></e-schedule-header-row>
        <e-schedule-header-row option="Date"></e-schedule-header-row>
        <e-schedule-header-row option="Hour"></e-schedule-header-row>
    </e-schedule-header-rows>
    <e-schedule-views>
        <e-schedule-view option="TimelineMonth"></e-schedule-view>
        <e-schedule-view option="TimelineWeek"></e-schedule-view>
        <e-schedule-view option="TimelineDay"></e-schedule-view>
    </e-schedule-views>
</ejs-schedule>
public ActionResult Index()
{
return View();
}
Timeline view displaying dates of a complete year
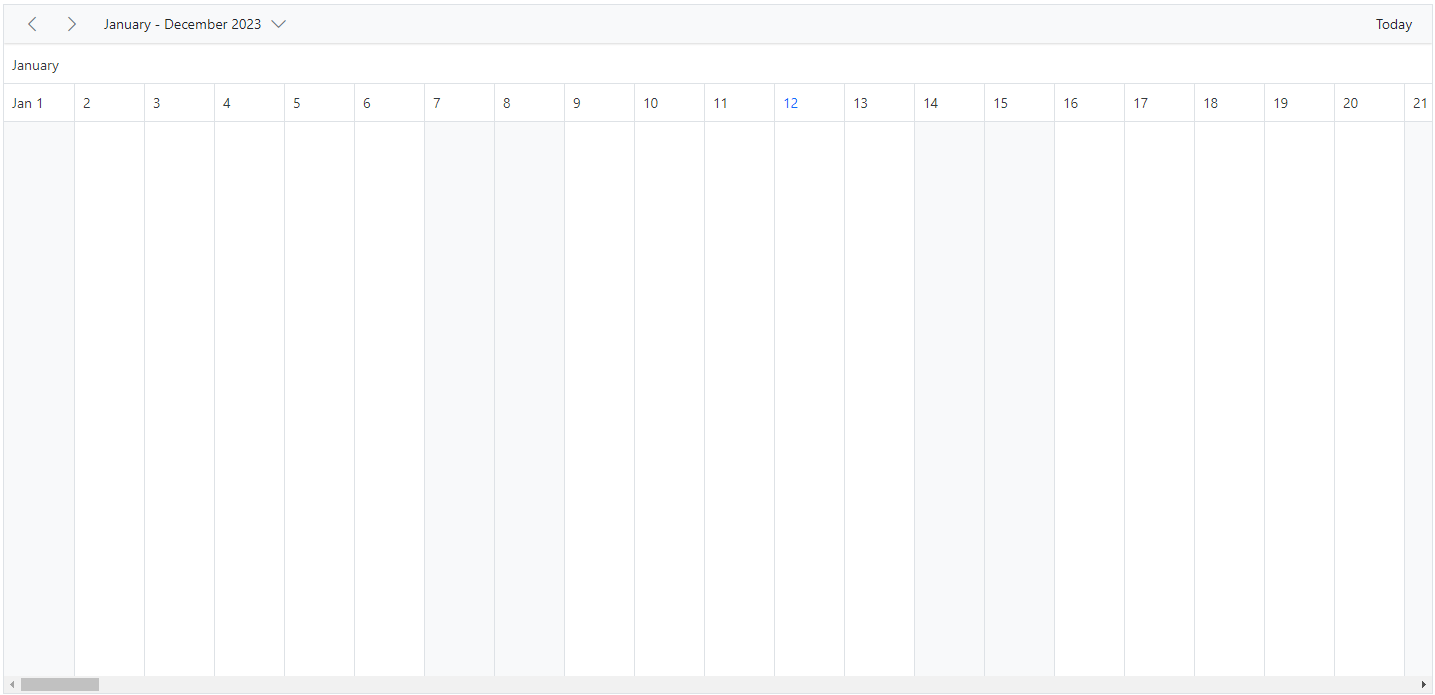
It is possible to display a complete year in a timeline view by setting the interval value to 12 and defining the TimelineMonth view option within the e-schedule-views tag helper of the Scheduler.
@using Syncfusion.EJ2.Schedule

<ejs-schedule id="schedule" width="100%" height="650px">
    <e-schedule-header-rows>
        <e-schedule-header-row option="Month"></e-schedule-header-row>
        <e-schedule-header-row option="Date"></e-schedule-header-row>
    </e-schedule-header-rows>
    <e-schedule-views>
        <e-schedule-view option="TimelineMonth" interval="12"></e-schedule-view>
    </e-schedule-views>
</ejs-schedule>
public ActionResult Index()
{
return View();
}
Customizing the header rows using template
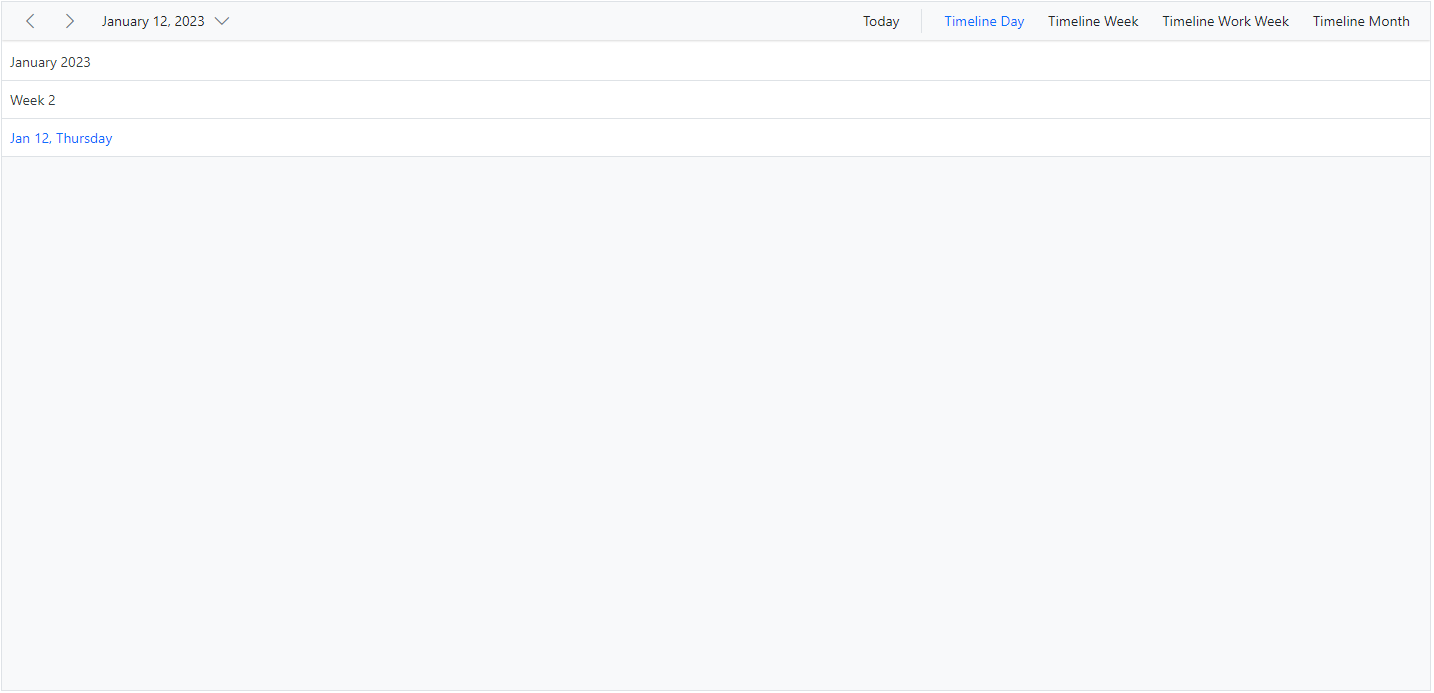
You can customize the text of the header rows and display images or formatted text in each individual header row by using the built-in template option within the headerRows property.
To get started quickly with the header row template option in Scheduler, watch this video:
@using Syncfusion.EJ2.Schedule

<ejs-schedule id="schedule" width="100%" height="650px">
    <e-schedule-header-rows>
        <e-schedule-header-row option="Month" template="#month-template"></e-schedule-header-row>
        <e-schedule-header-row option="Week" template="#week-template"></e-schedule-header-row>
        <e-schedule-header-row option="Date"></e-schedule-header-row>
    </e-schedule-header-rows>
    <e-schedule-views>
        <e-schedule-view option="TimelineDay"></e-schedule-view>
        <e-schedule-view option="TimelineWeek"></e-schedule-view>
        <e-schedule-view option="TimelineWorkWeek"></e-schedule-view>
        <e-schedule-view option="TimelineMonth"></e-schedule-view>
    </e-schedule-views>
</ejs-schedule>

<script id="month-template" type="text/x-template">
    <span class="month">${getMonthDetails(data)}</span>
</script>

<script id="week-template" type="text/x-template">
    <span class="week">${getWeekDetails(data)}</span>
</script>

<script type="text/javascript">
    var instance = new ej.base.Internationalization();
    window.getMonthDetails = function (value) {
        return instance.formatDate(value.date, { skeleton: 'yMMMM' });
    };
    window.getWeekDetails = function (value) {
        return 'Week ' + ej.schedule.getWeekNumber(value.date);
    };
</script>
public ActionResult Index()
{
return View();
}
You can refer to our ASP.NET Core Scheduler feature tour page for an overview of its features. You can also explore our ASP.NET Core Scheduler example to learn how to present and manipulate data.