How can I help you?
Getting Started
- This section explains briefly about how to create a TreeMap in your application with ReactJS.
- Here you can learn how to configure a TreeMap control in a real-time scenario where it is used to visually represent the percentage of growth in population in each continent.
- It also provides a walk-through on some of the customization features available in TreeMap control.
Create a TreeMap
You can easily create the TreeMap widget by following the below steps.
Adding Script Reference
Create an HTML page and add the scripts references in the order mentioned in the following code example.
The required ReactJS script dependencies as follows. And you can also refer React to know more about react js.
-
react.min.js- https://cdn.syncfusion.com/js/assets/external/react.min.js -
react-dom.min.js- https://cdn.syncfusion.com/js/assets/external/react-dom.min.js -
ej.web.react.min.js- https://cdn.syncfusion.com/33.1.44/js/common/ej.web.react.min.js
To get started, you can use the ej.web.all.min.js file that encapsulates all the ej controls and frameworks in one single file.
<!DOCTYPE html>
   <html>
     <head>
        <meta name="viewport" content="width=device-width, initial-scale=1.0">
        <meta name="description" content="Essential Studio for React JS">
        <meta name="author" content="Syncfusion">
        <title>Getting Started for Ribbon React JS</title>
        <!-- Essential Studio for JavaScript  theme reference -->
        <link href="http://cdn.syncfusion.com/33.1.44/js/web/flat-azure/ej.web.all.min.css" rel="stylesheet" />
        <!-- Essential Studio for JavaScript  script references -->
        <script src="http://cdn.syncfusion.com/js/assets/external/jquery-3.0.0.min.js"></script>
         <script src="http://cdn.syncfusion.com/js/assets/external/react.min.js"></script>
        <script src="http://cdn.syncfusion.com/js/assets/external/react-dom.min.js"></script>
        <script src="http://cdn.syncfusion.com/33.1.44/js/web/ej.web.all.min.js"></script>
        <script src="http://cdn.syncfusion.com/33.1.44/js/common/ej.web.react.min.js"></script>
        <!-- Add your custom scripts here -->
    </head>
        <body>
        </body>
   </html>
NOTE
- In production, we highly recommend you to use our
custom script generatorto create custom script file with required controls and its dependencies only. Also to reduce the file size further please useGZip compressionin your server.- For themes, you can use the
ej.web.all.min.cssCDN link from the code snippet given. To add the themes in your application, please refer tothis link.
Control Initialization
Control can be initialized in two ways.
- Using jsx Template
- Without using jsx Template
Using jsx Template
By using the jsx template, we can create the html file and jsx file. The .jsx file can be convert to .js file and it can be referred in html page.
Initialize TreeMap
1.Create a <div> tag with specific id
<!DOCTYPE html>
<html>
    <body>
	<div id="treemap-default" style="height:99%;"></div>
            <script src="app/treemap/default.js"></script>
    </body>
</html>
2.The dataSource property of the TreeMap accepts the collection values as input.Populate the datasource of the TreeMap data as JSON object. For example, you can use population data of countries to generate TreeMap data as illustrated in the following code sample.
var population_data = [
                   { Continent: "Asia", Region: "Southern Asia", Growth: 1.32, Population: 1749046000 },
                   { Continent: "Asia", Region: "Eastern Asia", Growth: 0.57, Population: 1620807000 },
                   { Continent: "Asia", Region: "South-Eastern Asia", Growth: 1.20, Population: 618793000 },
                   { Continent: "Asia", Region: "Western Asia", Growth: 1.98, Population: 245707000 },
                   { Continent: "Asia", Region: "Central Asia", Growth: 1.43, Population: 64370000 },
                   { Continent: "Europe", Region: "Europe", Growth: 0.10, Population: 742452000 },
                   { Continent: "America", Region: "South America", Growth: 1.06, Population: 406740000 },
                   { Continent: "America", Region: "Northern America", Growth: 0.85, Population: 355361000 },
                   { Continent: "America", Region: "Central America", Growth: 1.40, Population: 167387000 },
                   { Continent: "Africa", Region: "Eastern Africa", Growth: 2.89, Population: 373202000 },
                   { Continent: "Africa", Region: "Western Africa", Growth: 2.78, Population: 331255000 },
                   { Continent: "Africa", Region: "Northern Africa", Growth: 1.70, Population: 210002000 },
                   { Continent: "Africa", Region: "Middle Africa", Growth: 2.79, Population: 135750000 },
                   { Continent: "Africa", Region: "Southern Africa", Growth: 0.91, Population: 60425000 }
        ];
NOTE
Population data is referred from List of continents by population
3.The size of an object can be calculated by using the WeightValuePath of TreeMap
4.Initialize the TreeMap by using the EJ.TreeMap tag.
<script type="text/babel">
<!DOCTYPE html>
<html>
    <body>
        <script type="text/babel">
            ReactDOM.render(
                     <div className="default">
                        <EJ.TreeMap id="treemap1"  dataSource = {population_data}    weightValuePath ="Population" ></EJ.TreeMap>,
                     </div>,
                     document.getElementById('treemap-default')
                     );
        </script>
    </body>
</html>
The following image displays a TreeMap with default properties using the above code.

GroupTreeMap Items using Levels
You can group TreeMap Items using levels in TreeMap.
Group Path
You can use groupPath property for every flat level of the TreeMap control. It is a path to a field on the source object that serves as the “group” for the level specified. You can group the data based on the groupPath in the TreeMap control. When the groupPath is not specified, then the items are not grouped and the data is displayed in the order specified in the dataSource.
Group Gap
You can use groupGap property to separate the items from every flat level and to differentiate the levels mentioned in the TreeMap control.
The following code sample explains how to group TreeMap Items using ‘Levels’
<script type="text/babel">
var levels = [
{ groupPath: "Continent", groupGap: 5}
];
<!DOCTYPE html>
<html>
<body>
<script type="text/babel">
ReactDOM.render(
<div className="default">
<EJ.TreeMap id="treemap1" dataSource = {population_data} weightValuePath ="Population"
levels = {levels} ></EJ.TreeMap>,
</div>,
document.getElementById('treemap-default')
);
</script>
</body>
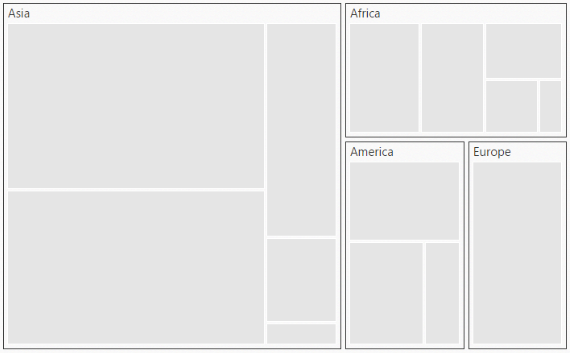
</html>The following screenshot displays grouping of TreeMapItems using Levels.
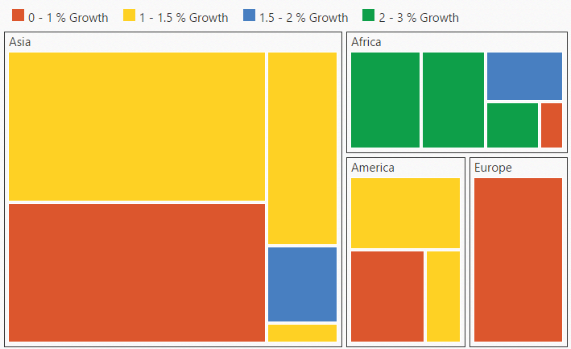
Customize TreeMap Appearance by Range
You can differentiate the nodes based on its value and color ranges using Range color. You can also define the color value range using From and To properties.
Color Value Path
The colorValuePath of TreeMap is a path to a field on the source object. You can determine the color for the object using colorValuePath of TreeMap.
The following code sample explains how to customize TreeMap Appearance by Range.
<script type="text/babel">
var levels = [
{ groupPath: "Continent", groupGap: 5}
];
var rangeColorMapping = [
{ color: "#DC562D", from: "0", to: "1" },
{ color: "#FED124", from: "1", to: "1.5" },
{ color: "#487FC1", from: "1.5", to: "2" },
{ color: "#0E9F49", from: "2", to: "3" }
];
<!DOCTYPE html>
<html>
<body>
<script type="text/babel">
ReactDOM.render(
<div className="default">
<EJ.TreeMap id="treemap1" dataSource = {population_data} weightValuePath ="Population"
levels = {levels} rangeColorMapping = {rangeColorMapping} colorValuePath="Growth" ></EJ.TreeMap>,
</div>,
document.getElementById('treemap-default')
);
</script>
</body>
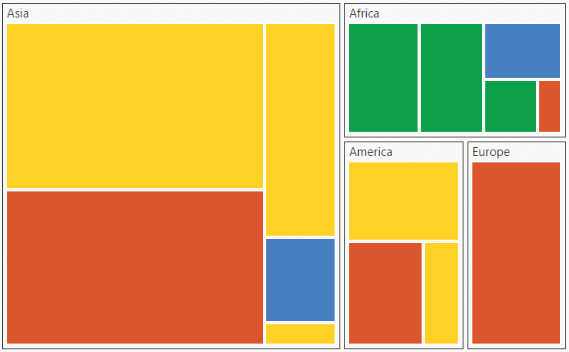
</html>The following screenshot displays customized TreeMap Appearance by Range
Enable Tooltip
You can enable the tooltip by setting showTooltip property to ‘true’. By default, it takes the property of the bound object that is referred in the weightValuePath and displays its content when the corresponding node is hovered. You can customize the template for tooltip using tooltipTemplate property.
Leaf Item Settings
You can customize the Leaf level TreeMap items using leafItemSettings. The Label and tooltip values take the property of bound object that is referred in the labelPath when defined.
The following code sample displays how the tooltip is enabled.
<script type="text/babel">
var levels = [
{ groupPath: "Continent", groupGap: 5}
];
var rangeColorMapping = [
{ color: "#DC562D", from: "0", to: "1" },
{ color: "#FED124", from: "1", to: "1.5" },
{ color: "#487FC1", from: "1.5", to: "2" },
{ color: "#0E9F49", from: "2", to: "3" }
];
var leafItemSettings = { labelPath: "Region" };
<!DOCTYPE html>
<html>
<body>
<script type="text/babel">
ReactDOM.render(
<div className="default">
<EJ.TreeMap id="treemap1" dataSource = {population_data} weightValuePath ="Population"
levels = {levels} rangeColorMapping = {rangeColorMapping} colorValuePath="Growth" leafItemSettings={leafItemSettings} showTooltip={true} ></EJ.TreeMap>,
</div>,
document.getElementById('treemap-default')
);
</script>
</body>
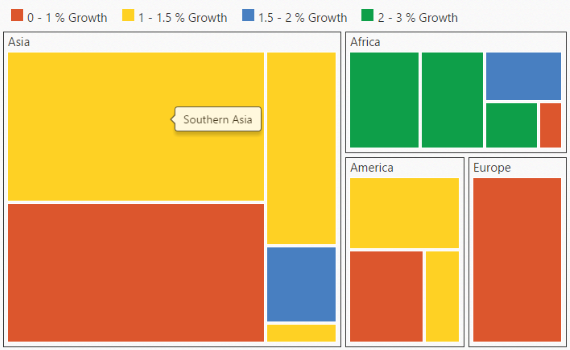
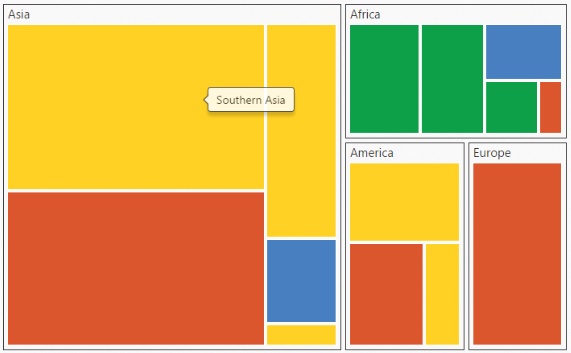
</html>The following screenshot displays the TreeMap when the Tooltip is enabled.
Legend
You can set the color value of leaf nodes using TreeMap Legend. This legend is appropriate only for the TreeMap whose leaf nodes are colored using rangeColorMapping.
You can set ShowLegend property value to ‘true’ to make a Legend visible.
Label for Legend
You can customize the labels of the legend item using legendLabel property of rangeColorMapping.
The following code sample displays how to add labels for legend in a TreeMap.
<script type="text/babel">

  var levels = [
                     { groupPath: "Continent", groupGap: 5}
                   ];
   var rangeColorMapping =  [
                    { color: "#DC562D", from: "0", to: "1" },
                    { color: "#FED124", from: "1", to: "1.5" },
                    { color: "#487FC1", from: "1.5", to: "2" },
                    { color: "#0E9F49", from: "2", to: "3" }
                ];
   var leafItemSettings =  { labelPath: "Region" };
   var legendSettings =  {
                  showLegend:true,
                  height:38,
                  width:690,
                };
<!DOCTYPE html>
<html>
    <body>
        <script type="text/babel">
            ReactDOM.render(
                     <div className="default">
                        <EJ.TreeMap id="treemap1"
                        dataSource = {population_data}
                        weightValuePath ="Population"
                        levels = {levels}
                        rangeColorMapping = {rangeColorMapping}
                        colorValuePath="Growth"
                        leafItemSettings={leafItemSettings}
                        showTooltip={true}
                        showLegend ={true}
                        legendSettings={legendSettings}></EJ.TreeMap>,
                     </div>,
                     document.getElementById('treemap-default')
                     );
        </script>
    </body>
</html>
The following screenshot displays the TreeMap when Labels are enabled.
Without using jsx Template
The TreeMap can be created from a HTML DIV element with the HTML id attribute set to it. Refer to the following code example.
<div id="treemap-default"></div><script type="text/babel">
var levels = [
{ groupPath: "Continent", groupGap: 5}
];
var rangeColorMapping = [
{ color: "#DC562D", from: "0", to: "1" },
{ color: "#FED124", from: "1", to: "1.5" },
{ color: "#487FC1", from: "1.5", to: "2" },
{ color: "#0E9F49", from: "2", to: "3" }
];
var leafItemSettings = { labelPath: "Region" };
var legendSettings = {
showLegend:true,
height:38,
width:690,
};
ReactDOM.render(
React.createElement(EJ.TreeMap, {id: "treeMapDefault",
dataSource: population_data,
colorValuePath: "Growth",
weightValuePath: "Population",
showTooltip:true,
showLegend: true,
leafItemSettings: leafItemSettings,
legendSettings: legendSettings,
rangeColorMapping: rangeColorMapping,
levels: levels
}
),
document.getElementById('treemap-default')
);
</script>On running the above code the TreeMap will rendered along with labels