How can I help you?
Getting Started
This section explains you the steps required to populate the RangeNavigator with data, add data labels, tooltips and title to the Chart. This section covers only the minimal features that you need to know to get started with the RangeNavigator.
Create your RangeNavigator
This section encompasses on how to configure the ejRangeNavigator and update the chart control for RangeNavigator’s selected range. It also helps you to learn how to pass the required data to RangeNavigator and customize the scale and selected range for your requirements. In this example, you will look at the steps to configure a RangeNavigator to analyze sales of a product for a particular quarter in a year.

Adding Script Reference
Create an HTML page and add the scripts references in the order mentioned in the following code example.
-
jQuery1.10.2 and later versions
The required ReactJS script dependencies as follows. And you can also refer React to know more about react js.
-
react.min.js- https://cdn.syncfusion.com/js/assets/external/react.min.js -
react-dom.min.js- https://cdn.syncfusion.com/js/assets/external/react-dom.min.js -
ej.web.react.min.js- https://cdn.syncfusion.com/32.2.3/js/common/ej.web.react.min.js
To get started, you can use the ej.web.all.min.js file that encapsulates all the ej controls and frameworks in one single file.
<!DOCTYPE html>
   <html>
     <head>
        <meta name="viewport" content="width=device-width, initial-scale=1.0">
        <meta name="description" content="Essential Studio for React JS">
        <meta name="author" content="Syncfusion">
        <title>Getting Started for Ribbon React JS</title>
        <!-- Essential Studio for JavaScript  theme reference -->
        <link href="http://cdn.syncfusion.com/32.2.3/js/web/flat-azure/ej.web.all.min.css" rel="stylesheet" />
        <!-- Essential Studio for JavaScript  script references -->
        <script src="http://cdn.syncfusion.com/js/assets/external/jquery-3.0.0.min.js"></script>
         <script src="http://cdn.syncfusion.com/js/assets/external/react.min.js"></script>
        <script src="http://cdn.syncfusion.com/js/assets/external/react-dom.min.js"></script>
        <script src="http://cdn.syncfusion.com/32.2.3/js/web/ej.web.all.min.js"></script>
        <script src="http://cdn.syncfusion.com/32.2.3/js/common/ej.web.react.min.js"></script>
        <!-- Add your custom scripts here -->
    </head>
        <body>
        </body>
   </html>
NOTE
- In production, we highly recommend you to use our
custom script generatorto create custom script file with required controls and its dependencies only. Also to reduce the file size further please useGZip compressionin your server.- For themes, you can use the
ej.web.all.min.cssCDN link from the code snippet given. To add the themes in your application, please refer tothis link.
Control Initialization
Control can be initialized in two ways.
- Using jsx Template
- Without using jsx Template
Using jsx Template
By using the jsx template, we can create the html file and jsx file. The .jsx file can be convert to .js file and it can be referred in html page.
Configure ejRangeNavigator
Getting started with your ejRangeNavigator is simple. You can initialize the ejRangeNavigator by setting its range values.
1.Create a <div> tag.
<!DOCTYPE html>
<html>
    <body>
	<div id="rangeNavigator-default" ></div>
            <script src="app/rangeNavigator/default.js"></script>
    </body>
</html>
2.Initialize the RangeNavigator by using the EJ.RangeNavigator tag.
<script type="text/babel">
use strict";
var rangeSettings={
start: "2010/1/1", end: "2010/12/31"
};
ReactDOM.render(
<div className="default">
ReactDOM.render(
<div className="default">
<EJ.RangeNavigator id="rangenavigator1" rangeSettings ={rangeSettings}></EJ.RangeNavigator>,
</div>,
document.getElementById('rangenavigator-default')
);
document.getElementById('rangenavigator-default')
);
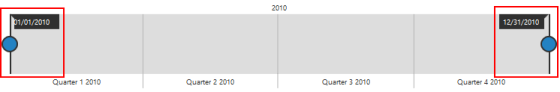
</script>The following Screen shot displays the RangeNavigator with a range from 2010 January 1st to December 31st.
Add series
To add a series to RangeNavigator, you need to set dataSource property, as given in the following code example.
You can create data source for RangeNavigator as follows.
var data = [{ "xDate": new Date(2011, 0, 1), "yValue": 10 },
                        { "xDate": new Date(2011, 2, 1), "yValue": 5 },
                        { "xDate": new Date(2011, 4, 1), "yValue": 15 },
                        { "xDate": new Date(2011, 6, 1), "yValue": 25 },
                        { "xDate": new Date(2011, 8, 1), "yValue": 10 },
                        { "xDate": new Date(2011, 10, 1), "yValue": 5 },
                        { "xDate": new Date(2011, 12, 1), "yValue": 15 }];
Now, add the dataSource to the RangeNavigator and provide the field name to get the values from the dataSource in xName and yName options
<script type="text/babel">
var series = [
{
type: 'line',
dataSource: data, xName: "XValue", yName: "YValue",
}
];
<!DOCTYPE html>
<html>
<body>
<script type="text/babel">
ReactDOM.render(
<div className="default">
<EJ.RangeNavigator id="rangenavigator1" series={series}></EJ.RangeNavigator>,
</div>,
document.getElementById('rangenavigator-default')
);
</script>
</body>
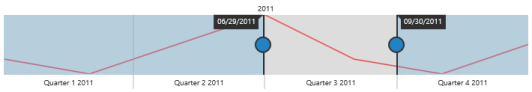
</html>The following screenshot displays the RangeNavigator with the type series as “line”.
Enable tooltip
Tooltip can be customized for RangeNavigator using tooltip option. You can also use TooltipDisplayMode option in tooltip to display the tooltip “always” or “ondemand” (displays tooltip only while dragging the sliders). You can also specify label format for tooltip using LabelFormat.
<script type="text/babel">
var tooltipSettings= {
visible: true, labelFormat: "MMM/yyy", tooltipDisplayMode: "always"
};
<!DOCTYPE html>
<html>
<body>
<script type="text/babel">
ReactDOM.render(
<div className="default">
<EJ.RangeNavigator id="rangenavigator1" tooltipSettings = {tooltipSettings}></EJ.RangeNavigator>,
</div>,
document.getElementById('rangenavigator-default')
);
</script>
</body>
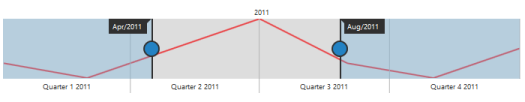
</html>The following screen shot displays the label format Tooltip in RangeNavigator:
Update Chart
You can use ejRangeNavigator with controls such as chart and grid to view the range of data selected in ejRangeNavigator.
In order to update chart, whenever the selected range changes in ejRangeNavigator, you need to use rangeChanged event of ejRangeNavigator and then update the chart with the selected data in this event.
You can create a chart with line series using the following code sample.
Create a <div> tag with an id for rendering the chart.
<body>
<div id="chart-default"></div>
</body><script type="text/babel">
function onChartLoaded(sender) {
var chartObj = $("#chart").data("ejChart");
if (chartObj != null) {
chartObj.model.primaryXAxis.zoomPosition = sender.zoomPosition;
chartObj.model.primaryXAxis.zoomFactor = sender.zoomFactor;
}
$("#default_chart_sample_0").ejChart("redraw");
};
ReactDOM.render(
<div className="default">
<EJ.RangeNavigator id="rangenavigator1" rangeChanged = {onChartLoaded} dataSource=data xName="XValue" yName="YValue"></EJ.RangeNavigator>,
</div>,
document.getElementById('rangenavigator-default')
);
var title = { text: "Sales Analysis" };
var legend = { visible: true, position: 'top' };
var primaryYAxis = {
title: { text: "Sales(Million)" }
};
var series = [
{
name: 'Product A', type: 'line',
dataSource: data, xName: "xDate", yName: "yValue"
}
];
ReactDOM.render(
<div className="default">
<EJ.Chart id="chart1" title = {title} legend = {legend} primaryYAxis = {primaryYAxis} series = {series}></EJ.Chart>
</div>,
document.getElementById('chart-default')
);
</script>
</body>
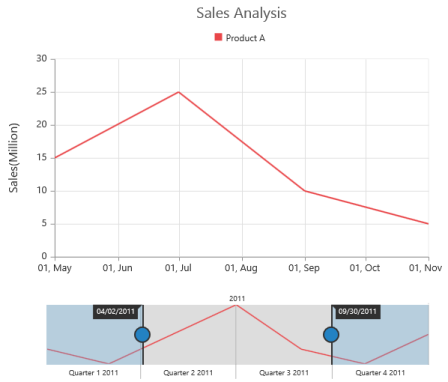
</html>The following screenshot displays how the RangeNavigator is updated when the selected range is changed.
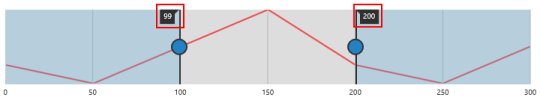
Set value type
RangeNavigator can also be used with numerical values. You can specify the data type using ValueType option.
First let’s create a DataSource for Chart Series with integer Values.
var Data = [
    { "xDate": 0, "yValue": 10 },
    { "xDate": 50, "yValue": 5 },
    { "xDate": 100, "yValue": 15 },
    { "xDate": 150, "yValue": 25 },
    { "xDate": 200, "yValue": 10 },
    { "xDate": 250, "yValue": 5 },
    { "xDate": 300, "yValue": 15 },
      ];
Now, you can set the dataSource for Chart Series and valueType property to “numeric” as given in the following code example.
<script type="text/babel">
var series  = [
                {
                     type: 'line',
                    dataSource: data, xName: "XValue", yName: "YValue",
                    }
                 ];
<!DOCTYPE html>
<html>
    <body>
        <script type="text/babel">
           ReactDOM.render(
                     <div className="default">
                        <EJ.RangeNavigator id="rangenavigator1" series={series} valueType=“numeric”></EJ.RangeNavigator>,
                     </div>,
                     document.getElementById('rangenavigator-default')
                     );

        </script>
    </body>
</html>
The following screenshot displays the RangeNavigator with numerical values:
Without using jsx Template
The Range Navigator can be created from a HTML DIV element with the HTML id attribute set to it. Refer to the following code example.
<div id="rangenavigator-default"></div><script type="text/babel">
var Data = [
{ "xDate": 0, "yValue": 10 },
{ "xDate": 50, "yValue": 5 },
{ "xDate": 100, "yValue": 15 },
{ "xDate": 150, "yValue": 25 },
{ "xDate": 200, "yValue": 10 },
{ "xDate": 250, "yValue": 5 },
{ "xDate": 300, "yValue": 15 },
];
var series = [
{
type: 'line',
dataSource: data, xName: "XValue", yName: "YValue",
}
];
ReactDOM.render(
React.createElement(EJ.RangeNavigator, {id: "defaultrangenaviagator1",
valueType: "numeric",
series: series,
}
),
document.getElementById('rangenavigator-default')
);
</script>
</body>
</html>The following screenshot displays the RangeNavigator with numerical values: