How can I help you?
Getting Started
-
This section explains briefly about how to create Maps in your application with TypeScript
-
You can learn how to configure Map with simple steps. In this example, you can learn how to configure USA population map with customized appearance and tooltip.
Create a Map
You can easily create the Map widget by following the below steps
Adding Script Reference
Create an HTML page and add the scripts references in the order mentioned in the following code example.
The required ReactJS script dependencies as follows. And you can also refer React to know more about ReactJS.
-
react.min.js- https://cdn.syncfusion.com/js/assets/external/react.min.js -
react-dom.min.js- https://cdn.syncfusion.com/js/assets/external/react-dom.min.js -
ej.web.react.min.js- https://cdn.syncfusion.com/33.1.44/js/common/ej.web.react.min.js
To get started, you can use the ej.web.all.min.js file that encapsulates all the ej controls and frameworks in one single file.
<!DOCTYPE html>
   <html>
     <head>
        <meta name="viewport" content="width=device-width, initial-scale=1.0">
        <meta name="description" content="Essential Studio for React JS">
        <meta name="author" content="Syncfusion">
        <title>Getting Started for Ribbon React JS</title>
        <!-- Essential Studio for JavaScript  theme reference -->
        <link href="http://cdn.syncfusion.com/33.1.44/js/web/flat-azure/ej.web.all.min.css" rel="stylesheet" />
        <!-- Essential Studio for JavaScript  script references -->
        <script src="http://cdn.syncfusion.com/js/assets/external/jquery-3.0.0.min.js"></script>
         <script src="http://cdn.syncfusion.com/js/assets/external/react.min.js"></script>
        <script src="http://cdn.syncfusion.com/js/assets/external/react-dom.min.js"></script>
        <script src="http://cdn.syncfusion.com/33.1.44/js/web/ej.web.all.min.js"></script>
        <script src="http://cdn.syncfusion.com/33.1.44/js/common/ej.web.react.min.js"></script>
        <!-- Add your custom scripts here -->
    </head>
        <body>
        </body>
   </html>
NOTE
- In production, we highly recommend you to use our
custom script generatorto create custom script file with required controls and its dependencies only. Also to reduce the file size further please useGZip compressionin your server.- For themes, you can use the
ej.web.all.min.cssCDN link from the code snippet given. To add the themes in your application, please refer tothis link.
Control Initialization
Control can be initialized in two ways.
- Using jsx Template
- Without using jsx Template
Using jsx Template
By using the jsx template, we can create the HTML file and jsx file. The .jsx file can be convert to .js file and it can be referred in html page.
Preparing Shape Data
The Shape Data collection describing geographical shape information can be obtained from GEOJSON format shapes.
In this example, USA shape is used as shape data by utilizing the United States of America.json file in the following folder structure obtained from downloaded Maps_GeoJSON folder.
..\ Maps_GeoJSON\All Countries with States
You can assign the complete contents in “United States of America.json” file to new JSON object. For your better understanding, a JS file “usa.js” is already created to store JSON data in JSON object “usMap”.
var usMap = //Paste all the content copied from the JSON file//Prepare Data Source
The datasource is populated with JSON data relative to shape data and stored in JSON object. USA population as datasource is used for better understanding.
The “populationData.js” file is used to store JSON data in JSON object “populationData”.
var populationData = [
        { name: "California", population: "38332521" },
        { name: "Texas", population: "26448193" },
        { name: "New York", population: "19651127" },
        { name: "Florida", population: "19552860" },
        { name: "Illinois", population: "12882135" },
        { name: "Pennsylvania", population: "12773801" },
        { name: "Ohio", population: "11570808" },
        { name: "Georgia", population: "9992167" },
        { name: "Michigan", population: "9895622" },
        { name: "North Carolina", population: "9848060" },
        { name: "New Jersey", population: "8899339" },
        { name: "Virginia", population: "8260405" },
        { name: "Washington", population: "6971406" },
        { name: "Massachusetts", population: "6692824" },
        { name: "Arizona", population: "6626624" },
        { name: "Indiana", population: "6570902" },
        { name: "Tennessee", population: "6495978" },
        { name: "Missouri", population: "6044171" },
        { name: "Maryland", population: "5928814" },
        { name: "Wisconsin", population: "5742713" },
        { name: "Minnesota", population: "5420380" },
        { name: "Colorado", population: "5268367" },
        { name: "Alabama", population: "4833722" },
        { name: "South Carolina", population: "4774839" },
        { name: "Louisiana", population: "4625470" },
        { name: "Kentucky", population: "4395295" },
        { name: "Oregon", population: "3930065" },
        { name: "Oklahoma", population: "3850568" },
        { name: "Puerto Rico", population: "3615086" },
        { name: "Connecticut", population: "3596080" },
        { name: "Iowa", population: "3090416" },
        { name: "Mississippi", population: "2991207" },
        { name: "Arkansas", population: "2959373" },
        { name: "Utah", population: "2900872" },
        { name: "Kansas", population: "2893957" },
        { name: "Nevada", population: "2790136" },
        { name: "New Mexico", population: "2085287" },
        { name: "Nebraska", population: "1868516" },
        { name: "West Virginia", population: "1854304" },
        { name: "Idaho", population: "1612136" },
        { name: "Hawaii", population: "1404054" },
        { name: "Maine", population: "1328302" },
        { name: "New Hampshire", population: "1323459" },
        { name: "Rhode Island", population: "1051511" },
        { name: "Montana", population: "1015165" },
        { name: "Delaware", population: "925749" },
        { name: "South Dakota", population: "844877" },
        { name: "Alaska", population: "735132" },
        { name: "North Dakota", population: "723393" },
        { name: "District of Columbia", population: "646449" },
        { name: "Vermont", population: "626630" },
        { name: "Wyoming", population: "582658" }
]
You can refer to shape data and datasource as illustrated in the HTML page,
<!-- Shape data file-->
    <script src="usa.js" type="text/javascript"></script>

    <!-- Data source file-->
    <script src="populationData.js" type="text/javascript"></script>
Initialize Map
1.Create a <div> tag and set the height and width to determine the map size.
<!DOCTYPE html>
<html>
    <body>
	<div id="map-default"  style="width: 900px; height: 600px;"></div>
            <script src="app/map/default.js"></script>
    </body>
</html>
2.Initialize the Map by using the EJ.Map tag.
"use strict";
ReactDOM.render(
    <div className="default">
        <EJ.Map id="map1"></EJ.Map>,
    </div>,
    document.getElementById('map-default')
    );
3.Add the shapeData property in the maps to render it in layers
<script type="text/babel">

var layers= [
                {
                    shapeData: usMap
                }];

<!DOCTYPE html>
<html>
    <body>
        <script type="text/babel">
            ReactDOM.render(
                     <div className="default">
                        <EJ.Map id="map1" layers={layers}></EJ.Map>,
                     </div>,
                     document.getElementById('map-default')
                     );
        </script>
    </body>
</html>
The above code renders a map with default properties and shape input provided through data in layers.
Data Binding in Map
The following properties in shape layers is used for binding data in Maps control.
- DataSource
- ShapeDataPath
- ShapePropertyPath
DataSource
The dataSource property accepts collection values as input. For example, you can provide the list of objects as input.
Shape Data Path
The shapeDataPath property is used to refer the data ID in DataSource. For example, population MapData contains data ids ‘Name’ and ‘Population’. The shapeDataPath and shapePropertyPath properties are related to each other (refer to shapePropertyPath for more details).
Shape Property Path
The shapePropertyPath property is similar to the shapeDataPath that refers the column name in the Data property of shape layers to identify the shape. When the values of the shapeDataPath property in the dataSource property and the value of shapePropertyPath in the Data property match, then the associated object from the dataSource is bound to the corresponding shape.
<script type="text/babel">

var layers= [
                {
                    shapeData: usMap,
                    shapeDataPath: "name",
                    shapePropertyPath: "name",
                    dataSource: populationData
                }];

<!DOCTYPE html>
<html>
    <body>
        <script type="text/babel">
            ReactDOM.render(
                     <div className="default">
                        <EJ.Map id="map1" layers={layers}></EJ.Map>,
                     </div>,
                     document.getElementById('map-default')
                     );
        </script>
    </body>
</html>
Customize Map Appearance
You can customize the shape’s color by using fill, stroke and strokeThickness properties in shapeSettings.
<script type="text/babel">

var layers= [
                {
                   shapeData: usMap,
                    shapeDataPath: "name",
                    shapePropertyPath: "name",
                    dataSource: populationData,
                    enableSelection: false,
                    enableMouseHover: true,
                    shapeSettings: {
                        fill: "#9CBF4E",
                        strokeThickness: "0.5",
                        stroke: "White",
                        highlightStroke: "White",
                        highlightColor: "#BC5353",
                        highlightBorderWidth: "1"
                    }
                }];

<!DOCTYPE html>
<html>
    <body>
        <script type="text/babel">
            ReactDOM.render(
                     <div className="default">
                        <EJ.Map id="map1" layers={layers}></EJ.Map>,
                     </div>,
                     document.getElementById('map-default')
                     );
        </script>
    </body>
</html>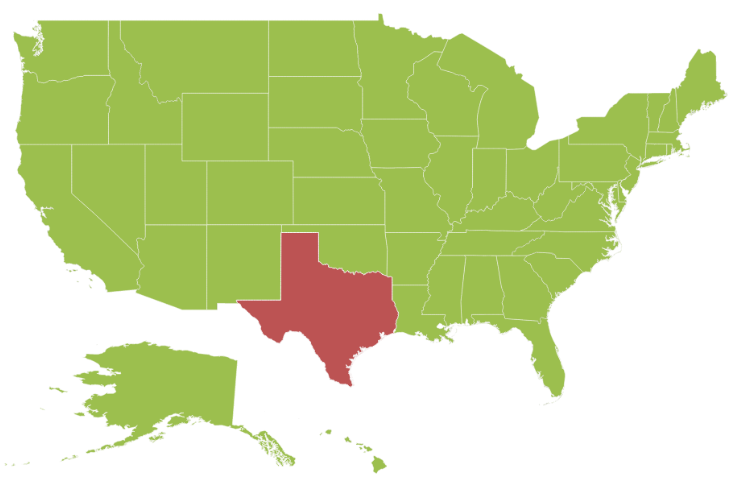
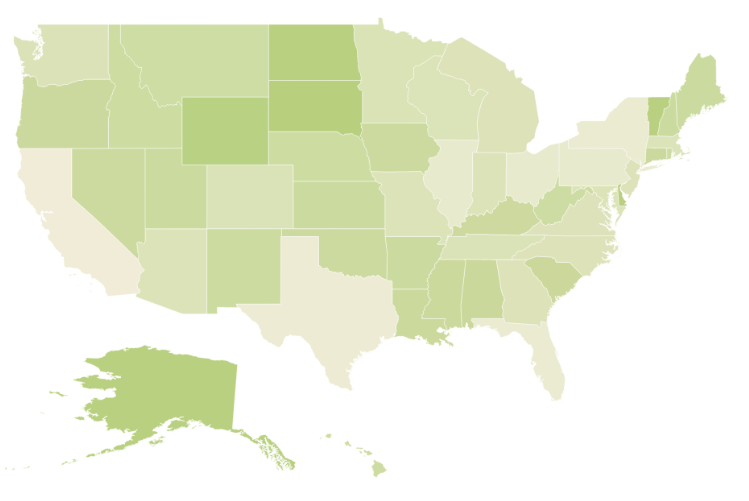
Customizing Map Appearance by Range
The Range color mapping is used to differentiate the shape’s fill based on its underlying value and color ranges. The from and to properties defines the value ranges and the gradientColors property defines the equivalent color ranges respective to their value ranges.
NOTE
The
enableGradientproperty value should be true to apply gradient colors for maps.
<script type="text/babel">

var layers= [
                {
                  shapeData: usMap,
                    shapeDataPath: "name",
                    shapePropertyPath: "name",
                    dataSource: populationData,
                    enableSelection: false,
                    enableMouseHover: true,
                    shapeSettings: {
                        fill: "#9CBF4E",
                        strokeThickness: "0.5",
                        stroke: "White",
                        highlightStroke: "White",
                        highlightColor: "#BC5353",
                        highlightBorderWidth: "1",
                        valuePath: "name",
                        colorValuePath: "population",
                        enableGradient: true,
                        colorMappings:
                        {
                            rangeColorMapping: [
                                {
                                    from: 500000,
                                    to: 1000000,
                                    gradientColors: ["#9CBF4E", "#B8CE7B"]
                                },
                                {
                                    from: 1000001,
                                    to: 5000000,
                                    gradientColors: ["#B8CE7B", "#CBD89A"]
                                },
                                {
                                    from: 5000001,
                                    to: 10000000,
                                    gradientColors: ["#CBD89A", "#DEE2B9"]
                                },
                                {
                                    from: 10000001,
                                    to: 40000000,
                                    gradientColors: ["#DEE2B9", "#F1ECD8"]
                                }
                            ]
                        }
                    }
                }];

<!DOCTYPE html>
<html>
    <body>
        <script type="text/babel">
            ReactDOM.render(
                     <div className="default">
                        <EJ.Map id="map1" layers={layers}></EJ.Map>,
                     </div>,
                     document.getElementById('map-default')
                     );
        </script>
    </body>
</html>
The following screenshot illustrates a Map with gradient color property enabled.
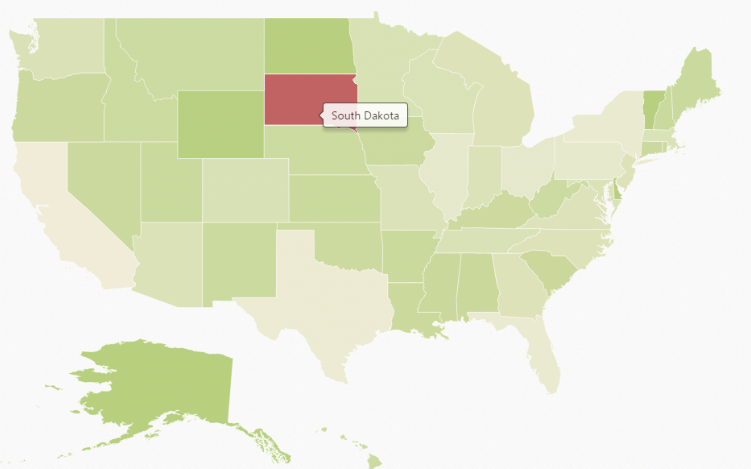
Enable Tooltip
The tooltip is displayed only when showTooltip is set to ‘true’ in the shape layers. By default, it takes the property of the bound object that is referred in the valuePath and displays its content on hovering the corresponding shape. The tooltipTemplate property is used for customizing the template for tooltip.
<script type="text/babel">
var layers= [
                {
                   // ...
                    shapeSettings: {
                        // ...
                        valuePath: "name",
                        // ...
                    },
                    showTooltip: true

                }];

<!DOCTYPE html>
<html>
    <body>
        <script type="text/babel">
            ReactDOM.render(
                     <div className="default">
                        <EJ.Map id="map1" layers={layers}></EJ.Map>,
                     </div>,
                     document.getElementById('map-default')
                     );
        </script>
    </body>
</html>
The following screenshot illustrates a map control displaying a Tooltip.
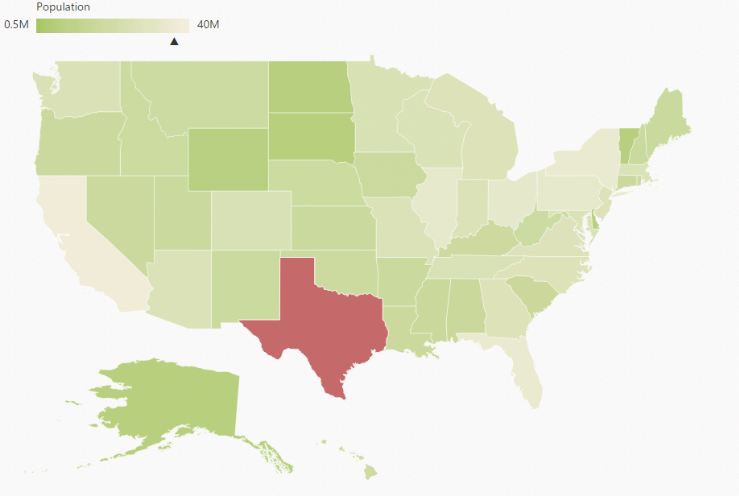
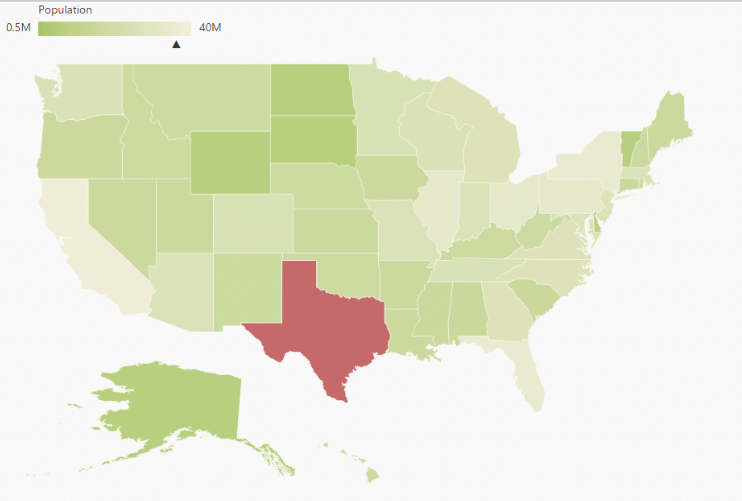
Legend
A Legend can be made visible by setting the showLegend property in legendSetting.
Interactive Legend
The legends can be made interactive with an arrow mark indicating the exact range color in the legend, when the mouse hovers the corresponding shapes. You can enable this option by setting mode property in legendSettings value as ‘Interactive’. The default value of mode property is ‘Default’ to enable the normal legend.
Title
Use title property to provide title for interactive legend.
Label
You can use leftLabel and rightLabel property to provide left and right labels for interactive legend.
<script type="text/babel">
var layers= [
                {
                    shapeData: usMap,
                    shapeDataPath: "name",
                    shapePropertyPath: "name",
                    dataSource: populationData,
                    enableSelection: false,
                    enableMouseHover: true,
                    shapeSettings: {
                        fill: "#9CBF4E",
                        strokeThickness: "0.5",
                        stroke: "White",
                        highlightStroke: "White",
                        highlightColor: "#BC5353",
                        highlightBorderWidth: "1",
                        valuePath: "population",
                        enableGradient: true,
                        colorMappings:
                        {
                            rangeColorMapping: [
                            {
                                from: 500000,
                                to: 1000000,
                                gradientColors: ["#9CBF4E", "#B8CE7B"]
                            },
                            {
                                from: 1000001,
                                to: 5000000,
                                gradientColors: ["#B8CE7B", "#CBD89A"]
                            },
                            {
                                from: 5000001,
                                to: 10000000,
                                gradientColors: ["#CBD89A", "#DEE2B9"]
                            },
                            {
                                from: 10000001,
                                to: 40000000,
                                gradientColors: ["#DEE2B9", "#F1ECD8"]
                            }]
                        }
                    },
                    legendSettings: {
                        showLegend:true,
						dockOnMap:true,
                        height:18,
                        width:190,
                        mode:"interactive",
                        title: "Population",
                        leftLabel: "0.5M",
                        rightLabel: "40M"
                    }
                }];

<!DOCTYPE html>
<html>
    <body>
        <script type="text/babel">
            ReactDOM.render(
                     <div className="default">
                        <EJ.Map id="map1" layers={layers}></EJ.Map>,
                     </div>,
                     document.getElementById('map-default')
                     );
        </script>
    </body>
</html>
The following screenshot illustrates a map displaying an interactive legend.
Without using jsx Template
The Map can be created from a HTML DIV element with the HTML id attribute set to it. Refer to the following code example.
<div id="map-default"></div>On running the above code the Map will rendered along with tooltip