How can I help you?
Getting Started
This section briefly explains on how to create a Linear Gauge control for your application.
- You can provide data for a Linear Gauge and display them in a required way. You can also customize the default Linear Gauge appearance to meet your requirements.
- In this example, you will learn how to create a Linear Gauge and how to design a thermometer, which can be used to check the body temperature of a person.

Adding Script Reference
Create an HTML page and add the scripts references in the order mentioned in the following code example.
-
jQuery1.10.2 and later versions
The required ReactJS script dependencies as follows. And you can also refer React to know more about ReactJS.
-
react.min.js- https://cdn.syncfusion.com/js/assets/external/react.min.js -
react-dom.min.js- https://cdn.syncfusion.com/js/assets/external/react-dom.min.js -
ej.web.react.min.js- https://cdn.syncfusion.com/33.1.44/js/common/ej.web.react.min.js
To get started, you can use the ej.web.all.min.js file that encapsulates all the ej controls and frameworks in one single file.
<!DOCTYPE html>
   <html>
     <head>
        <meta name="viewport" content="width=device-width, initial-scale=1.0">
        <meta name="description" content="Essential Studio for React JS">
        <meta name="author" content="Syncfusion">
        <title>Getting Started for Ribbon React JS</title>
        <!-- Essential Studio for JavaScript  theme reference -->
        <link href="http://cdn.syncfusion.com/33.1.44/js/web/flat-azure/ej.web.all.min.css" rel="stylesheet" />
        <!-- Essential Studio for JavaScript  script references -->
        <script src="http://cdn.syncfusion.com/js/assets/external/jquery-3.0.0.min.js"></script>
         <script src="http://cdn.syncfusion.com/js/assets/external/react.min.js"></script>
        <script src="http://cdn.syncfusion.com/js/assets/external/react-dom.min.js"></script>
        <script src="http://cdn.syncfusion.com/33.1.44/js/web/ej.web.all.min.js"></script>
        <script src="http://cdn.syncfusion.com/33.1.44/js/common/ej.web.react.min.js"></script>
        <!-- Add your custom scripts here -->
    </head>
        <body>
        </body>
   </html>
NOTE
- In production, we highly recommend you to use our
custom script generatorto create custom script file with required controls and its dependencies only. Also to reduce the file size further please useGZip compressionin your server.- For themes, you can use the
ej.web.all.min.cssCDN link from the code snippet given. To add the themes in your application, please refer tothis link.
Control Initialization
Control can be initialized in two ways.
- Using jsx Template
- Without using jsx Template
Using jsx Template
By using the jsx template, we can create the HTML file and jsx file. The .jsx file can be convert to .js file and it can be referred in HTML page.
Create a Linear Gauge
You can easily create the Linear Gauge widget by using the following steps.
1.Create a <div> tag.
<!DOCTYPE html>
<html>
    <body>
	<div id="linearGauge-default" ></div>
            <script src="app/lineargauge/default.js"></script>
    </body>
</html>
2.Initialize the LinearGauge by using the EJ.LinearGauge tag
"use strict";
ReactDOM.render(
<div className="default">
<EJ.LinearGauge id="lineargauge1"></EJ.LinearGauge>,
</div>,
document.getElementById('linearGauge-default')
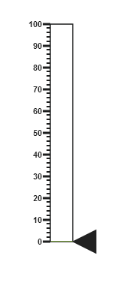
);Run the above code example to get a default Linear Gauge with default values as follows.
Set Height and Width values
Basic attributes of each canvas elements are height and width. You can set the height and width of the gauge using the following code example. It sets the height and width of the canvas image where the thermometer is to be rendered.
<script type="text/babel">
<!DOCTYPE html>
<html>
<body>
<script type="text/babel">
ReactDOM.render(
<div className="default">
<EJ.LinearGauge id="lineargauge1" height={550} width={500}></EJ.LinearGauge>,
</div>,
document.getElementById('linearGauge-default')
);
</script>
</body>
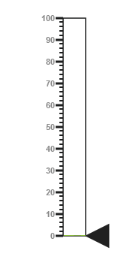
</html>Run the above code example and you will get the following gauge as similar to default. Here height and width of the canvas are set for given values.
Set Animation option and Label Color
- You can draw the Thermometer with some Label color to display the measurement value. For example give the labelColor as “#8c8c8c”.
- Set the EnableAnimation property as false to avoid animation on the pointers.
<script type="text/babel">
<!DOCTYPE html>
<html>
<body>
<script type="text/babel">
ReactDOM.render(
<div className="default">
<EJ.LinearGauge id="lineargauge1" height={550} width={500} labelColor="#8c8c8c" enableAnimation={false}></EJ.LinearGauge>,
</div>,
document.getElementById('linearGauge-default')
);
</script>
</body>
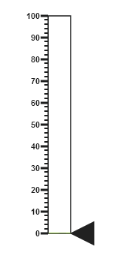
</html>Run the above code example and you will get the following gauge as the output.
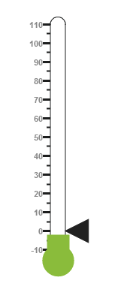
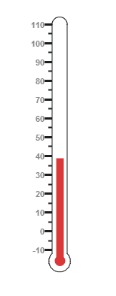
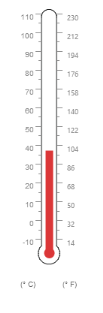
Provide Scale Values
- The scale must have the appearance of a thermometer. By giving ScaleType as Thermometer, you can render a thermometer design.
- Minimum temperature can go up to -10 and maximum temperature can rise up to 110, so you can give minimum scale value as -10 and maximum value as 110.
- Set the location values such as vertical and horizontal position of the thermometer and give the thermometer height as Length.
- You can give the Minor Interval value as 5 to get the exact temperature on the patient.
<script type="text/babel">

var scale = [
              {
                type: "thermometer",
                backgroundColor: "transparent",
                minimum: -10,
                maximum: 110,
                minorIntervalValue: 5,
                width: 20,
                position: { x: 50, y: 18 },
                length: 355,
                border: { width: 0.5 }
                }
];

<!DOCTYPE html>
<html>
    <body>
        <script type="text/babel">
            ReactDOM.render(
                     <div className="default">
                        <EJ.LinearGauge id="lineargauge1" height={550} width={500} labelColor="#8c8c8c" enableAnimation={false} scales={scale}></EJ.LinearGauge>,
                     </div>,
                     document.getElementById('linearGauge-default')
                     );
        </script>
    </body>
</html>
Run the above code example and you will get the following gauge as the output.
Add Pointers
In Linear Gauge the two types of pointers available are: Marker pointer and Bar pointer.
- Marker pointer is displayed as a pointer device that shows the actual values. But for your thermometer there is no need for the marker pointer. So you can hide the marker pointer by giving opacity as 0.
- Bar pointer acts as the mercury metal that shows the exact temperature of the patient. Set some of the basic properties of the Bar pointer such as Width, BarPointerDistanceFromScale, BarPointerValue and BarPointerBackgroundColor.
<script type="text/babel">

var scale = [
              {  //Add the pointers customization code here
                markerPointers: [{ opacity: 0 }],
                barPointers: [{
                    width: 10,
                    distanceFromScale: -0.5,
                    value: 37,
                    backgroundColor: "#DB3738"
                }],
                }
];

<!DOCTYPE html>
<html>
    <body>
        <script type="text/babel">
            ReactDOM.render(
                     <div className="default">
                        <EJ.LinearGauge id="lineargauge1" height={550} width={500} labelColor="#8c8c8c" enableAnimation={false} scales={scale}></EJ.LinearGauge>,
                     </div>,
                     document.getElementById('linearGauge-default')
                     );
        </script>
    </body>
</html>
On executing the above code sample renders a Linear Gauge with bar marker as follows.
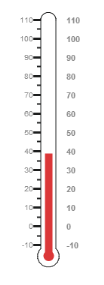
##Add Label Customization
- For thermometer, you can display the label value on two sides, to get temperature in different scales. For that you can add two label values in an array.
- To display the value around the scales, labels are used. You can customize the label placement, font (including its style and family) and its distance from scale.
<script type="text/babel">
var scale = [{
              labels: [{
                    placement: "near",
                    font: {
                        size: "10px", fontFamily: "Segoe UI",
                        fontStyle: "Normal"
                    }
                },
                {
                    placement: "far",
                    distanceFromScale: { x: 10 }
                }],
                }
];

<!DOCTYPE html>
<html>
    <body>
        <script type="text/babel">
            ReactDOM.render(
                     <div className="default">
                        <EJ.LinearGauge id="lineargauge1" height={550} width={500} labelColor="#8c8c8c" enableAnimation={false} scales={scale}></EJ.LinearGauge>,
                     </div>,
                     document.getElementById('linearGauge-default')
                     );
        </script>
    </body>
</html>
On executing the above code sample renders a customized Linear Gauge as follows.
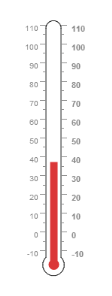
Add Tick Details
- Tick style has two values called major interval and minor interval. You can set major ticks width and height greater than Minor ticks. And you can give TickColor, for better visibility in light backgrounds.
- Here four tick details are used for both sides having minor and major ticks. To display the tick value add the following code example.
<script type="text/babel">
var scale = [{
             ticks: [{
                    type: "majorInterval",
                    height: 8,
                    width: 1,
                    color: "#8c8c8c",
                    distanceFromScale: { y: -4 }
                }, {
                    type: "minorInterval",
                    height: 4,
                    width: 1,
                    color: "#8c8c8c",
                    distanceFromScale: { y: -4 }
                }, {
                    type: "majorInterval",
                    placement: "far",
                    height: 8,
                    width: 1,
                    color: "#8c8c8c",
                    distanceFromScale: { y: -4 }
                }, {
                    type: "minorInterval",
                    placement: "far",
                    height: 4,
                    width: 1,
                    color: "#8c8c8c",
                    distanceFromScale: { y: -4 }
                }],
                }
];

<!DOCTYPE html>
<html>
    <body>
        <script type="text/babel">
            ReactDOM.render(
                     <div className="default">
                        <EJ.LinearGauge id="lineargauge1" height={550} width={500} labelColor="#8c8c8c" enableAnimation={false} scales={scale}></EJ.LinearGauge>,
                     </div>,
                     document.getElementById('linearGauge-default')
                     );
        </script>
    </body>
</html>
On executing the above code sample renders a Linear Gauge with custom labels as follows.
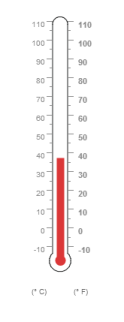
Add Custom Label Details
- Custom labels are used to specify the texts in the gauge.
- It can be customized through various properties.
- In order to show the custom labels, change the showIndicators property to true.
- Here you can use custom text to display three range descriptions.
<script type="text/babel">
var scale = [{
            showCustomLabels: true,
                 customLabels: [{
                    value: "(° C)",
                    position: { x: 44, y: 78 },
                    font: { size: "13px", fontFamily: "Segoe UI", fontStyle: "bold" }, color: "#666666"
                }, {
                    value: "(° F)",
                    position: { x: 56, y: 78 },
                    font: { size: "13px", fontFamily: "Segoe UI", fontStyle: "bold" }, color: "#666666"
                },
                {
                    position: { x: 51, y: 90 },
                    font: { size: "13px", fontFamily: "Segoe UI", fontStyle: "bold" },
                    color: "#666666"
                }]
               }
];

<!DOCTYPE html>
<html>
    <body>
        <script type="text/babel">
            ReactDOM.render(
                     <div className="default">
                        <EJ.LinearGauge id="lineargauge1" height={550} width={500} labelColor="#8c8c8c" enableAnimation={false} scales={scale}></EJ.LinearGauge>,
                     </div>,
                     document.getElementById('linearGauge-default')
                     );
        </script>
    </body>
</html>
Run the above code example to get the following gauge as output.
Change Scale from Degree to Fahrenheit
Add the function that converts the temperature in degree to Fahrenheit in the label, with an index value of 1.
<script type="text/babel">
function label(args)
{
if (args.label.index == 1) {
            args.style.textValue = (args.label.value * (9 / 5)) + 32;
             args.style.font = { size: "10px", fontFamily: "Segoe UI", fontStyle: "normal" };
        }
};

<!DOCTYPE html>
<html>
    <body>
        <script type="text/babel">
            ReactDOM.render(
                     <div className="default">
                        <EJ.LinearGauge id="lineargauge1" height={550} width={500} labelColor="#8c8c8c" enableAnimation={false} drawLabels={label}></EJ.LinearGauge>,
                     </div>,
                     document.getElementById('linearGauge-default')
                     );
        </script>
    </body>
</html>
Run the above code example and you will get the following gauge as output.
Add Custom Label for Current Value
Add the function that displays the current temperature value in the custom label.
<script type="text/babel">
function customLabel(args) {
        if (args.customLabelIndex == 2) {
            var temp = args.scaleElement.barPointers[0].value;
            var faValue = (temp * (9 / 5)) + 32;
            if (temp == -10) {
                args.style.textValue = "Very Cold Weather" + "(" + faValue.toFixed(1) + "° F)";
            }
            else if ((temp > -10 && temp < 0) || (temp > 0 && temp < 15)) {
                args.style.textValue = "Cool Weather" + " (" + faValue.toFixed(1) + "° F)";
            }
            else if (temp == 0) {
                args.style.textValue = "Freezing point of Water" + " (" + faValue.toFixed(1) + "° F)";
            }
            else if (temp >= 15 && temp < 30) {
                args.style.textValue = "Room Temperature" + " (" + faValue.toFixed(1) + "° F)";
            }
            else if (temp == 30) {
                args.style.textValue = "Beach Weather" + " (" + faValue.toFixed(1) + "° F)";
            }
            else if (temp == 37) {
                args.style.textValue = "Body Temperature" + " (" + faValue.toFixed(1) + "° F)";
            }
            else if (temp == 40) {
                args.style.textValue = "Hot Bath Temperature" + " (" + faValue.toFixed(1) + "° F)";
            }
            else if (temp > 40 && temp < 100) {
                args.style.textValue = "Very Hot Temperature" + " (" + faValue.toFixed(1) + "° F)";
            }
            else if (temp == 100) {
                args.style.textValue = "Boiling point of Water" + " (" + faValue.toFixed(1) + "° F)";
            }
        }
    }

<!DOCTYPE html>
<html>
    <body>
        <script type="text/babel">
            ReactDOM.render(
                     <div className="default">
                        <EJ.LinearGauge id="lineargauge1" height={550} width={500} labelColor="#8c8c8c" enableAnimation={false} drawLabels={label} drawCustomLabels={customLabel}></EJ.LinearGauge>,
                     </div>,
                     document.getElementById('linearGauge-default')
                     );
        </script>
    </body>
</html>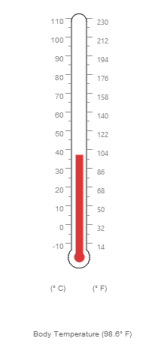
Without using jsx Template
The Linear Gauge can be created from a HTML DIV element with the HTML id attribute set to it. Refer to the following code example.
<div id="linearGauge-default"></div><script type="text/babel">
var scale = [
{
type: "thermometer",
backgroundColor: "transparent",
minimum: -10,
maximum: 110,
minorIntervalValue: 5,
width: 20,
position: { x: 50, y: 18 },
length: 355,
border: { width: 0.5 }
}
];
ReactDOM.render(
React.createElement(EJ.LinearGauge, {id: "default",
labelColor: "#8c8c8c",
scales: scale,
width: 500,
height: 550,
}
),
document.getElementById('linearGauge-default')
);
</script>Run the above code example and you will see the following output.