How can I help you?
Getting Started with ReactJS HeatMap
This section helps to get started of the HeatMap component for ReactJS.
Adding Script Reference
Create an HTML page and add the scripts references in the order mentioned in the following code example.
-
jQuery1.10.2 and later versions
The required ReactJS script dependencies as follows. And you can also refer React to know more about react js.
-
react.min.js- https://cdn.syncfusion.com/js/assets/external/react.min.js -
react-dom.min.js- https://cdn.syncfusion.com/js/assets/external/react-dom.min.js -
ej.web.react.min.js- https://cdn.syncfusion.com/33.1.44/js/common/ej.web.react.min.js
To get started, you can use the ej.web.all.min.js file that encapsulates all the ej controls and frameworks in one single file.
<!DOCTYPE html>
   <html>
     <head>
        <meta name="viewport" content="width=device-width, initial-scale=1.0">
        <meta name="description" content="Essential Studio for React JS">
        <meta name="author" content="Syncfusion">
        <title>Getting Started for Ribbon React JS</title>
        <!-- Essential Studio for JavaScript  theme reference -->
        <link href="http://cdn.syncfusion.com/33.1.44/js/web/flat-azure/ej.web.all.min.css" rel="stylesheet" />
        <!-- Essential Studio for JavaScript  script references -->
        <script src="http://cdn.syncfusion.com/js/assets/external/jquery-3.0.0.min.js"></script>
        <script src="http://cdn.syncfusion.com/js/assets/external/react.min.js"></script>
        <script src="http://cdn.syncfusion.com/js/assets/external/react-dom.min.js"></script>
        <script src="http://cdn.syncfusion.com/33.1.44/js/web/ej.web.all.min.js"></script>
        <script src="http://cdn.syncfusion.com/33.1.44/js/common/ej.web.react.min.js"></script>
        <!-- Add your custom scripts here -->
    </head>
        <body>
        </body>
   </html>
NOTE
- In production, we highly recommend you to use our
custom script generatorto create custom script file with required controls and its dependencies only. Also to reduce the file size further please useGZip compressionin your server.- For themes, you can use the
ej.web.all.min.cssCDN link from the code snippet given. To add the themes in your application, please refer tothis link.
Control Initialization
Control can be initialized in two ways.
- Using jsx Template
- Without using jsx Template
Using jsx Template
By using the jsx template, we can create the html file and jsx file. The .jsx file can be convert to .js file and it can be referred in html page.
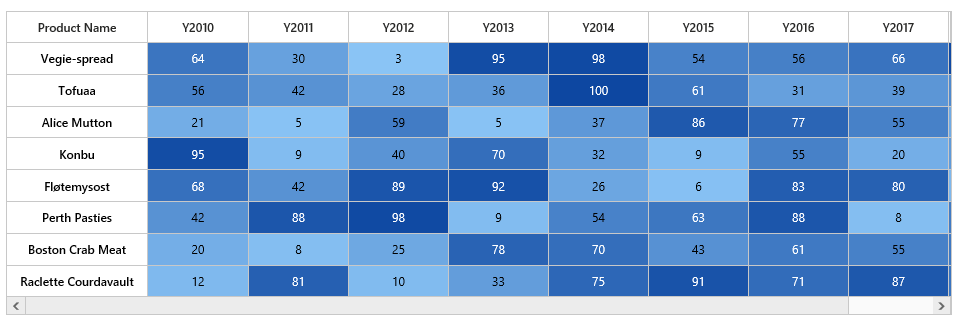
Initialize HeatMap
The HeatMap can be created from a HTML ‘div’ element. To create the HeatMap, you should call the ‘ejHeatMap’ jQuery plug-in function.
<div id="heatmap-default" style="height:99%;margin: 0 auto;"></div>
	<script src="app/heatmap/default.js">
</script>
</div>
Prepare and Populate data
Populate product information in a collection called ItemsSource.
Map data into HeatMap
Now data is ready, next we need to configure data source and map rows and columns to visualize. For that, need to prepare ItemsMapping add it in resource and set items source and mapping.
Next we can configure color range for these values using color mapping and also configure items mapping based on items source.
var colorMappingCollection = [
                { value: 0, color: "#8ec8f8", label: { text: "0" } },
                { value: 100, color: "#0d47a1", label: { text: "100" } }
                ];
var columns = ["Vegie-spread", "Tofuaa", "Alice Mutton", "Konbu", "Fløtemysost", "Perth Pasties", "Boston Crab Meat", "Raclette Courdavault"]
var itemSource = [];
for (var i = 0; i < columns.length; i++) {
    for (var j = 0; j < 8; j++) {
        var value = Math.floor((Math.random() * 100) + 1);
            itemSource.push({ ProductName: columns[i], Year: "Y"+(2011 + j), Value: value })
            }
        };
var itemsMapping= {
    column: { "propertyName": "ProductName", "displayName": "Product Name" },
    row: { "propertyName": "Year", "displayName": "Year", },
    value: { "propertyName": "Value" },
    headerMapping: { "propertyName": "Year", "displayName": "Year", columnStyle: { width: 105, textAlign: "right" } },
    columnMapping: [
        { "propertyName": columns[0], "displayName": columns[0] },
        { "propertyName": columns[1], "displayName": columns[1] },
        { "propertyName": columns[2], "displayName": columns[2] },
        { "propertyName": columns[3], "displayName": columns[3] },
        { "propertyName": columns[4], "displayName": columns[4] },
        { "propertyName": columns[5], "displayName": columns[5] },
        { "propertyName": columns[6], "displayName": columns[6] },
        { "propertyName": columns[7], "displayName": columns[7] },
    ],
};

ReactDOM.render(
    <div className="default"></div>
        <EJ.HeatMap id="heatmap1" width="810px" height="50px" itemsSource={ itemSource} itemsMapping= {itemsMapping} isResponsive="true colorMappingCollection="colorMappingCollection">
    </EJ.HeatMap>,
    document.getElementById('heatmap-default')
);
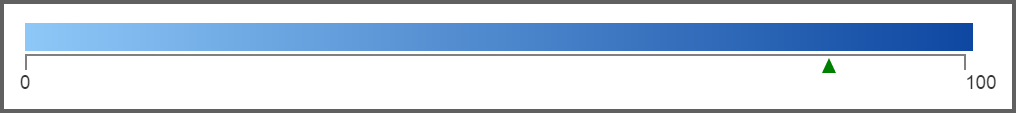
Initialize Legend
A legend control is used to represent range value in a gradient, create a legend with the same color mapping as shown below.
<div id="heatmap-default-legend" style="height:99%;margin-left:100px;"></div>
	<script src="app/heatmap/default.js">
</script>var colorMappingCollection = [
{ value: 0, color: "#8ec8f8", label: { text: "0" } },
{ value: 100, color: "#0d47a1", label: { text: "100" } }
];
ReactDOM.render(
<div>
<div className="default"></div>
<EJ.HeatMapLegend id="heatmap1_legend" width="75%" height="50px" isResponsive="true colorMappingCollection="colorMappingCollection">
</EJ.HeatMapLegend>
</div>,
document.getElementById('heatmap-default-legend')
);
Without using jsx Template
Initialize HeatMap
The HeatMap can be created from a HTML ‘div’ element. To create the HeatMap, you should call the ‘ejHeatMap’ jQuery plug-in function.
<div id="heatmap-default" style="height:99%;margin: 0 auto;"></div>
</div>var colorMappingCollection = [
{ value: 0, color: "#8ec8f8", label: { text: "0" } },
{ value: 100, color: "#0d47a1", label: { text: "100" } }
];
var columns = ["Vegie-spread", "Tofuaa", "Alice Mutton", "Konbu", "Fløtemysost", "Perth Pasties", "Boston Crab Meat", "Raclette Courdavault"]
var itemSource = [];
for (var i = 0; i < columns.length; i++) {
for (var j = 0; j < 8; j++) {
var value = Math.floor((Math.random() * 100) + 1);
itemSource.push({ ProductName: columns[i], Year: "Y"+(2011 + j), Value: value })
}
};
var itemsMapping= {
column: { "propertyName": "ProductName", "displayName": "Product Name" },
row: { "propertyName": "Year", "displayName": "Year", },
value: { "propertyName": "Value" },
headerMapping: { "propertyName": "Year", "displayName": "Year", columnStyle: { width: 105, textAlign: "right" } },
columnMapping: [
{ "propertyName": columns[0], "displayName": columns[0] },
{ "propertyName": columns[1], "displayName": columns[1] },
{ "propertyName": columns[2], "displayName": columns[2] },
{ "propertyName": columns[3], "displayName": columns[3] },
{ "propertyName": columns[4], "displayName": columns[4] },
{ "propertyName": columns[5], "displayName": columns[5] },
{ "propertyName": columns[6], "displayName": columns[6] },
{ "propertyName": columns[7], "displayName": columns[7] },
],
};
React.createElement(EJ.HeatMap, {
id: "heatmap1",
colorMappingCollection: colorMappingCollection,
width: "810",
isResponsive: true,
itemsSource: itemSource,
itemsMapping: itemsMapping
}),
document.getElementById('heatmap-default')
Initialize Legend
A legend control is used to represent range value in a gradient, create a legend with the same color mapping as shown below.
<div id="heatmap-default-legend" style="height:99%;margin-left:100px;"></div>
</script>var colorMappingCollection = [
{ value: 0, color: "#8ec8f8", label: { text: "0" } },
{ value: 100, color: "#0d47a1", label: { text: "100" } }
];
React.createElement(EJ.HeatMapLegend, {
id: "heatmap1_legend",
colorMappingCollection: colorMappingCollection,
height: "50px",
width: "75%",
isResponsive: true
}),
document.getElementById('heatmap-default-legend')