Getting Started
6 Jun 202314 minutes to read
This section explains briefly about how to create a Gantt chart in your application with ReactJS.
Create your first Gantt in ReactJS
To get started Syncfusion ReactJS application refer this page for basic control integration and script references.
In this tutorial, you can learn how to create a simple Gantt chart, add tasks or subtasks, and set relationship between tasks during the design phase of a software project. The following screenshot displays the desired output after completing this tutorial,
The required ReactJS script dependencies as follows. And you can also refer React to know more about react js.
-
react.min.js- https://cdn.syncfusion.com/js/assets/external/react.min.js -
react-dom.min.js- https://cdn.syncfusion.com/js/assets/external/react-dom.min.js -
browser.min.js- http://cdnjs.cloudflare.com/ajax/libs/babel-core/5.8.34/browser.min.js -
ej.web.react.min.js- https://cdn.syncfusion.com/28.1.33/js/common/ej.web.react.min.js
Adding script references
Create an HTML file and add the following template to the HTML file.
To get started, you can use the ej.web.all.min.js file that encapsulates all the ej controls and frameworks in one single file. So the complete boilerplate code is
<!DOCTYPE html>

    <html xmlns="http://www.w3.org/1999/xhtml">

    <head>

        <title>Getting Started with Gantt Control for Aurelia</title>

        <!-- style sheet for default theme(flat azure) -->
        <link href="http://cdn.syncfusion.com/28.1.33/js/web/flat-azure/ej.web.all.min.css" rel="stylesheet" />

        <!--scripts-->
        <script src="http://cdn.syncfusion.com/js/assets/external/react.min.js"></script>

        <script src="http://cdn.syncfusion.com/js/assets/external/react-dom.min.js"></script>

        <script src="https://cdnjs.cloudflare.com/ajax/libs/babel-core/5.8.34/browser.min.js"></script>

        <script src="http://cdn.syncfusion.com/js/assets/external/jquery-1.10.2.min.js"></script>

        <script src="http://cdn.syncfusion.com/js/assets/external/jsrender.min.js"></script>

        <script src="http://cdn.syncfusion.com/js/assets/external/jquery.globalize.min.js"></script>

        <script src="http://cdn.syncfusion.com/js/assets/external/jquery.easing.1.3.min.js"></script>

        <script src="http://cdn.syncfusion.com/28.1.33/js/web/ej.web.all.min.js "></script>

        <script src="http://cdn.syncfusion.com/28.1.33/js/common/ej.web.react.min.js"></script>
    </head>

    <body>
        <!--Add  Gantt control here-->
    </body>

    </html>
Initialize the Gantt with data source
Create a Gantt
Control can be initialized in two ways.
- Using jsx Template
- Without using jsx Template
Using jsx Template
By using the jsx template, we can create the html file and jsx file. The .jsx file can be convert to .js file and it can be referred in html page.
Please refer to the code of HTML file.
<div id="Gantt-default"></div>
       <script type="text/babel" src="app.jsx">
       </script>
Create an app.JSX file and paste the following content
var projectData = [{
    TaskId: 1,
    TaskName: "Project Schedule",
    StartDate: "02/03/2014",
    EndDate: "03/07/2014",
    col1: "check",
    Children: [{
        TaskId: 2,
        TaskName: "Design",
        StartDate: "02/10/2014",
        EndDate: "02/14/2014",
        Children: [{
            TaskId: 3,
            TaskName: "Software Specification",
            StartDate: "02/10/2014",
            EndDate: "02/12/2014",
            Duration: 3,
            Progress: "60",
            resourceId: [2]
        }, {
            TaskId: 4,
            TaskName: "Develop prototype",
            StartDate: "02/10/2014",
            EndDate: "02/12/2014",
            Duration: 3,
            Progress: "100",
            resourceId: [3]
        }, {
            TaskId: 5,
            TaskName: "Get approval from customer",
            StartDate: "02/13/2014",
            EndDate: "02/14/2014",
            Duration: 2,
            Progress: "100",
            Predecessor: "4FS",
            resourceId: [1]
        }, {
            TaskId: 6,
            TaskName: "Design complete",
            StartDate: "02/14/2014",
            EndDate: "02/14/2014",
            Duration: 0,
            Predecessor: "5FS"
        }]
    }, ]
}];
ReactDOM.render(
  <EJ.Gantt dataSource = {projectData}
    childMapping = "Children"
    taskIdMapping = "TaskId"
    taskNameMapping = "TaskName"
    startDateMapping = "StartDate"
    endDateMapping = "EndDate"
    durationMapping = "Duration"
    progressMapping = "Progress"
    treeColumnIndex = {1}>

    </EJ.Gantt>,
    document.getElementById('Gantt-default')
);
A Gantt chart is created as shown in the following screen shot.
Enable Toolbar
Gantt control contains toolbar options to edit, search, expand or collapse all records, indent, outdent, delete, and add a task. You can enable toolbar using the toolbarSettings property.
var toolbarsettings = {
showToolbar: true,
toolbarItems: [
ej.Gantt.ToolbarItems.Add,
ej.Gantt.ToolbarItems.Edit,
ej.Gantt.ToolbarItems.Delete,
ej.Gantt.ToolbarItems.Update,
ej.Gantt.ToolbarItems.Cancel,
ej.Gantt.ToolbarItems.Indent,
ej.Gantt.ToolbarItems.Outdent,
ej.Gantt.ToolbarItems.ExpandAll,
ej.Gantt.ToolbarItems.CollapseAll
]
};
var editsettings = {
allowEditing: true,
allowAdding: true,
allowDeleting: true,
allowIndent: true,
editMode: 'cellEditing'
};
ReactDOM.render(
<EJ.Gantt toolbarSettings = {toolbarsettings}
editSettings = {editsettings}>
</EJ.Gantt>,
document.getElementById('Gantt-default')
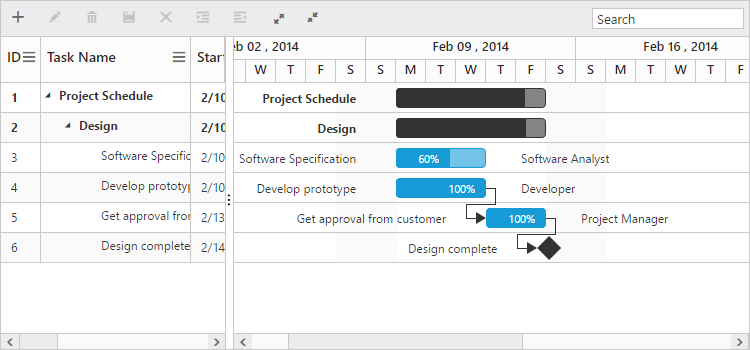
);The following screen shot displays a Tool bar in Gantt chart control:
NOTE
Add, edit, delete, indent and outdent options are enabled when enabling the allowEditing, allowAdding, allowDelete, allowIndent and allowOutdent properties in the edit Options.
Enable Sorting
The Gantt control has sorting functionality to arrange the tasks in ascending or descending order based on a particular column.
Multicolumn Sorting
Enable the multicolumn sorting in Gantt by setting allowMultiSorting as true. You can sort multiple columns in Gantt, by selecting the desired column header while holding the CTRL key.
ReactDOM.render(
  <EJ.Gantt dataSource = {projectData}
        allowSorting = {true}
        allowMultiSorting = {true}>

</EJ.Gantt>,
   document.getElementById('Gantt-default')
);
Enable Editing
You can enable editing using editSettings and allowGanttChartEditing options.
Cell Editing
Modify the task details through the grid cell editing by setting the editMode as cellEditing.
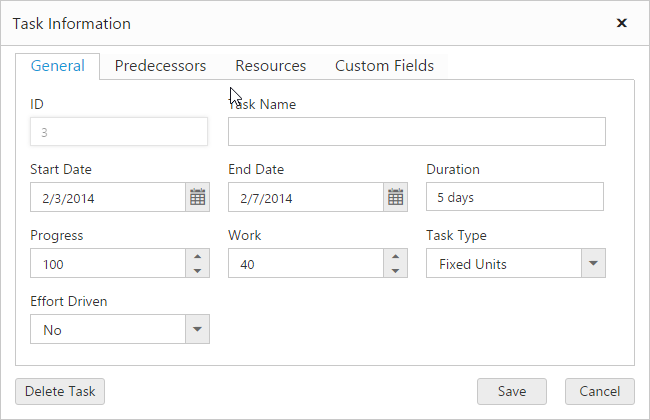
Normal Editing
Modify the task details through the edit dialog by setting the editMode as normal.
Taskbar Editing
Modify the task details through user interaction such as resizing and dragging the taskbar.
Predecessor Editing
Modify the predecessor details of a task using mouse interactions by setting allowGanttChartEditing as true and setting the value for predecessorMapping property.
var editsettings = {
allowEditing: true,
allowAdding: true,
allowDeleting: true,
allowIndent: true,
editMode: 'cellEditing'
};
ReactDOM.render(
<EJ.Gantt dataSource = {projectData}
allowGanttChartEditing = {true}
predecessorsMapping = "Predecessor"
editSettings = {editsettings}>
</EJ.Gantt>,
document.getElementById('Gantt-default')
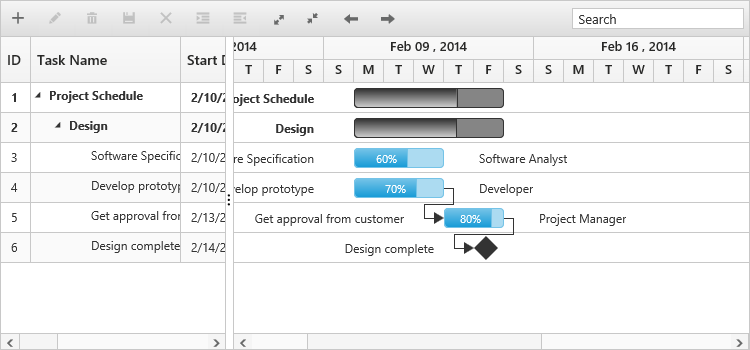
);The following screen shot displays a Gantt chart control with Enable Editing options.
NOTE
Both cellEditing and normal editing operations are performed through double-click or single click action that can be defined by editSettings.beginEditAction property.
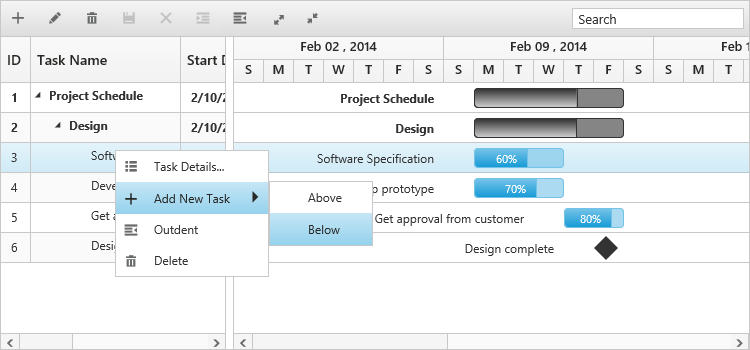
Enable Context Menu
You can enable the context menu in Gantt, by setting the enableContextMenu as true.
ReactDOM.render(
     <EJ.Gantt dataSource = {projectData}
     enableContextMenu = {true}>

     </EJ.Gantt>,
     document.getElementById('Gantt-default')
 );
The following screen shot displays Gantt chart in which Context menu option is enabled:
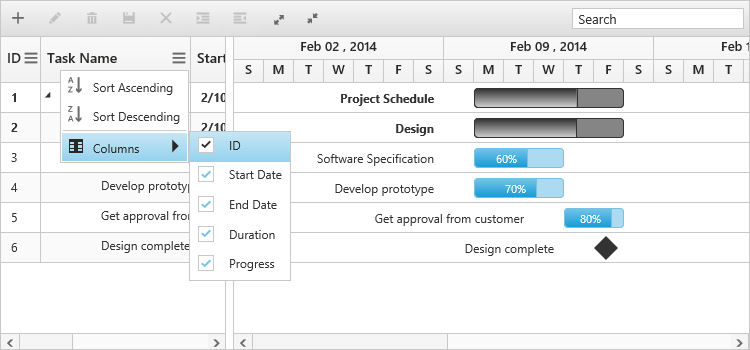
Enable Column Menu
You can enable the column menu in Gantt, by setting the showColumnChooser as true.
ReactDOM.render(
   <EJ.Gantt dataSource = {projectData}
     showColumnChooser = {true}>

   </EJ.Gantt>,
     document.getElementById('Gantt-default')
 );
The following screen shot displays Gantt chart in which column chooser option is enabled:
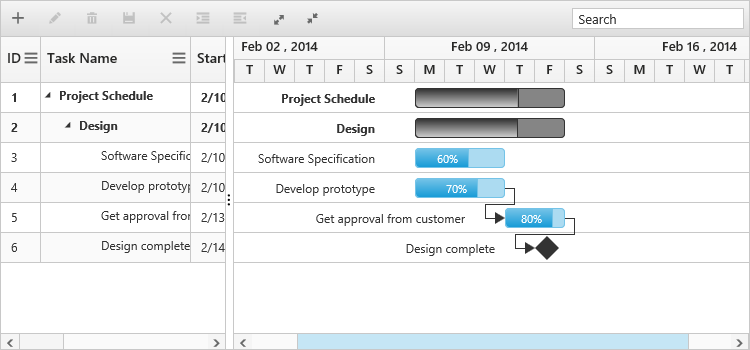
Provide tasks relationship
In Gantt, you have the predecessor support to show the relationship between two different tasks.
- Start to Start (SS) - You cannot start a task until the other task also starts.
- Start to Finish (SF) - You cannot finish a task until the other task finishes.
- Finish to Start (FS) - You cannot start a task until the other task completes.
- Finish to Finish (FF) - You cannot finish a task until the other task completes.
You can show the relationship in tasks, by using the predecessorMapping
, as shown in the following code example.
ReactDOM.render(
<EJ.Gantt dataSource = {projectData}
predecessorsMapping = "Predecessor" >
</EJ.Gantt>,
document.getElementById('Gantt-default')
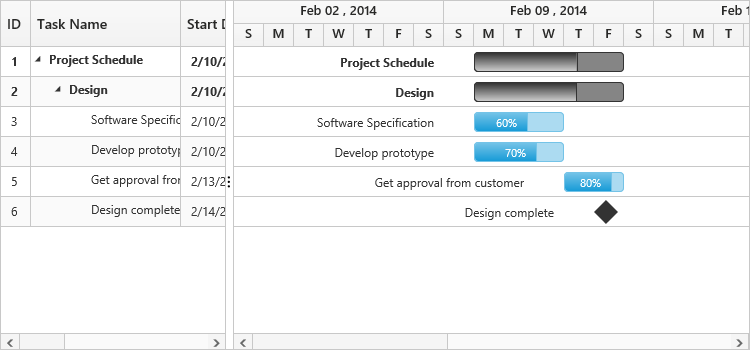
);The following screenshot displays the relationship between tasks.
Provide Resources
In Gantt control, you can display and assign the resource for each task. Create a collection of JSON object, which contains id and name of the resource and assign it to resources property. Then, specify the field name for id and name of the resource in the resource collection to resourceIdMapping and resourceNameMapping options. The name of the field, which contains the actual resources assigned for a particular task in the dataSource is specified using resourceInfoMapping.
1.Create the resource collection to be displayed in ejGantt
var projectResources = [{
    resourceId: 1,
    resourceName: "Project Manager"
}, {
    resourceId: 2,
    resourceName: "Software Analyst"
}, {
    resourceId: 3,
    resourceName: "Developer"
}, {
    resourceId: 4,
    resourceName: "Testing Engineer"
}];
ReactDOM.render(
    <EJ.Gantt resourceInfoMapping = "resourceId"
    resourceNameMapping = "resourceName"
    resourceIdMapping = "resourceId"
    resources = {
        projectResources
    }>

    </EJ.Gantt>,
    document.getElementById('Gantt-default')
);
The following screenshot displays resource allocation for tasks in Gantt chart.
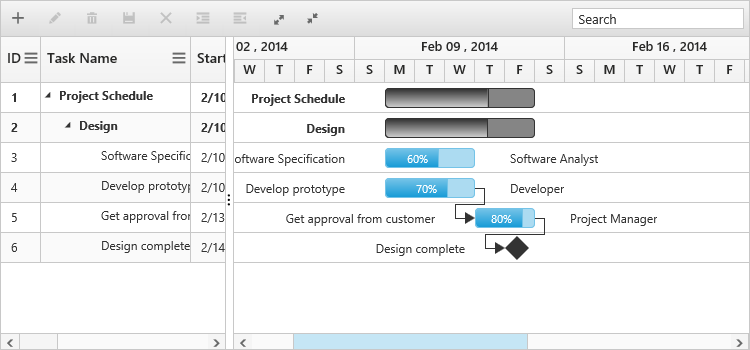
By following these steps, you have learned how to provide data source to Gantt chart, how to configure Gantt to set task relationships, assign resources for each task, and add toolbar with necessary buttons.
Highlight Weekend
In Gantt, you can on or off weekends high lighting by setting the highlightWeekends
as true or false.
ReactDOM.render(
<EJ.Gantt dataSource = {projectData}
highlightWeekends = {true}>
</EJ.Gantt>,
document.getElementById('Gantt-default')
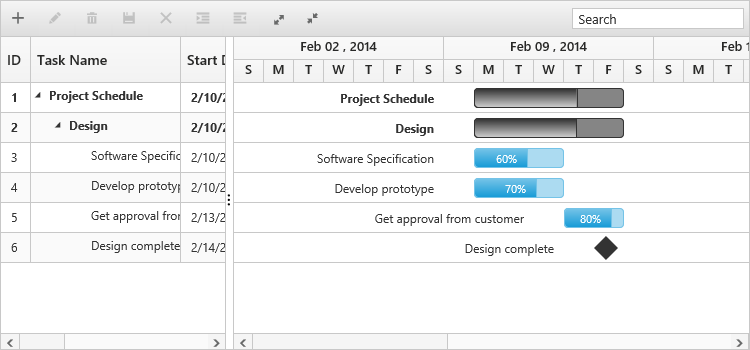
);The following screen shot displays Gantt chart in which highlight weekends is enabled: