Getting Started
6 Jun 202324 minutes to read
This section explains briefly about how to create a BulletGraph control in your application with ReactJs
Adding Script Reference
Create an HTML page and add the scripts references in the order mentioned in the following code example.
The required ReactJS script dependencies as follows. And you can also refer React to know more about ReactJS.
-
react.min.js- https://cdn.syncfusion.com/js/assets/external/react.min.js -
react-dom.min.js- https://cdn.syncfusion.com/js/assets/external/react-dom.min.js -
ej.web.react.min.js- https://cdn.syncfusion.com/28.1.33/js/common/ej.web.react.min.js
To get started, you can use the ej.web.all.min.js file that encapsulates all the ej controls and frameworks in one single file.
<!DOCTYPE html>
   <html>
     <head>
        <meta name="viewport" content="width=device-width, initial-scale=1.0">
        <meta name="description" content="Essential Studio for React JS">
        <meta name="author" content="Syncfusion">
        <title>Getting Started for Ribbon React JS</title>
        <!-- Essential Studio for JavaScript  theme reference -->
        <link href="http://cdn.syncfusion.com/28.1.33/js/web/flat-azure/ej.web.all.min.css" rel="stylesheet" />
        <!-- Essential Studio for JavaScript  script references -->
        <script src="http://cdn.syncfusion.com/js/assets/external/jquery-3.0.0.min.js"></script>
        <script src="http://cdn.syncfusion.com/js/assets/external/jsrender.min.js"></script>
        <script src="http://cdn.syncfusion.com/js/assets/external/react.min.js"></script>
        <script src="http://cdn.syncfusion.com/js/assets/external/react-dom.min.js"></script>
        <script src="http://cdn.syncfusion.com/28.1.33/js/web/ej.web.all.min.js"></script>
        <script src="http://cdn.syncfusion.com/28.1.33/js/common/ej.web.react.min.js"></script>
        <!-- Add your custom scripts here -->
    </head>
        <body>
        </body>
   </html>
NOTE
- In production, we highly recommend you to use our
custom script generatorto create custom script file with required controls and its dependencies only. Also to reduce the file size further please useGZip compressionin your server.- For themes, you can use the
ej.web.all.min.cssCDN link from the code snippet given. To add the themes in your application, please refer tothis link.
Control Initialization
Control can be initialized in two ways.
- Using jsx Template
- Without using jsx Template
Using jsx Template
By using the jsx template, we can create the HTML file and jsx file. The .jsx file can be convert to .js file and it can be referred in HTML page.
Creating the first Bullet Graph
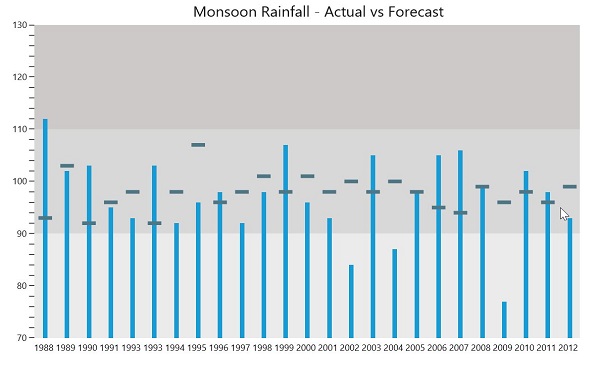
This section encompasses the details on how to configure the BulletGraph control in your application. It also allows you to learn how to pass the required data to it and customize its various options according to your requirements.
In the following screenshot, a BulletGraph is used to compare the actual monsoon rainfall received in a state versus its forecasted values for the years ranging from 1988 to 2013.
1.Create a <div> tag.
<!DOCTYPE html>
<html>
    <body>
	<div id="bulletGraph-default" style="height:99%;"></div>
            <script src="app/bulletgraph/default.js"></script>
    </body>
</html>
2.Initialize the BulletGraph by using the EJ.BulletGraph tag.
"use strict";
ReactDOM.render(
    <div className="default">
        <EJ.BulletGraph id="bulletGraph1"></EJ.BulletGraph>,
    </div>,
    document.getElementById('bulletGraph-default')
    );
Execute the above code to display the BulletGraph. To customize the measure bars in the BulletGraph, you can pass the data either locally or remotely.
Provide Required Data
You can customize the values of feature and comparative measure bars in a BulletGraph, either locally or remotely. The category data is optional, and it is used to display label values parallel to the measure bars.
Assign the data in LocalData variable to the DataSource property of BulletGraph as illustrated in the following code example.
var localData = [
            {
                value: 90, comparativeMeasureValue: 100,
                category: 2013
            },
            {
                value: 93, comparativeMeasureValue: 99,
                category: 2012
            },
            {
                value: 98, comparativeMeasureValue: 96,
                category: 2011
            },
            {
                value: 102, comparativeMeasureValue: 98,
                category: 2010
            },
            {
                value: 77, comparativeMeasureValue: 96,
                category: 2009
            },
            {
                value: 99, comparativeMeasureValue: 99,
                category: 2008
            },
            {
                value: 106, comparativeMeasureValue: 94,
                category: 2007
            },
            {
                value: 105, comparativeMeasureValue: 95,
                category: 2006
            },
            {
                value: 98, comparativeMeasureValue: 98,
                category: 2005
            },
            {
                value: 87, comparativeMeasureValue: 100,
                category: 2004
            },
            {
                value: 105, comparativeMeasureValue: 98,
                category: 2003
            },
            {
                value: 84, comparativeMeasureValue: 101,
                category: 2002
            },
            {
                value: 93, comparativeMeasureValue: 98,
                category: 2001
            },
            {
                value: 90, comparativeMeasureValue: 96,
                category: 2000
            },
            {
                value: 95, comparativeMeasureValue: 107,
                category: 1999
            },
            {
                value: 104, comparativeMeasureValue: 98,
                category: 1998
            },
            {
                value: 102, comparativeMeasureValue: 92,
                category: 1997
            },
            {
                value: 103, comparativeMeasureValue: 98,
                category: 1996
            },
            {
                value: 100, comparativeMeasureValue: 96,
                category: 1995
            },
            {
                value: 110, comparativeMeasureValue: 92,
                category: 1994
            },
            {
                value: 100, comparativeMeasureValue: 103,
                category: 1993
            },
            {
                value: 94, comparativeMeasureValue: 93,
                category: 1992
            },
            {
                value: 91, comparativeMeasureValue: 95,
                category: 1991
            },
            {
                value: 107, comparativeMeasureValue: 103,
                category: 1990
            },
            {
                value: 101, comparativeMeasureValue: 102,
                category: 1989
            },
            {
                value: 119, comparativeMeasureValue: 112,
                category: 1988
            }];
Once the DataSource property is assigned with the required values, you can bind the variable names used in the JSON data to the corresponding fields of the BulletGraph as shown in the following code example.
<script type="text/babel">
var fields= {
dataSource: localData, category: "category",
featureMeasures: "value",
comparativeMeasure: "comparativeMeasureValue"
};
<!DOCTYPE html>
<html>
<body>
<script type="text/babel">
ReactDOM.render(
<div className="default">
<EJ.BulletGraph id="bulletGraph1" fields: {fields} ></EJ.BulletGraph>,
</div>,
document.getElementById('bulletGraph-default')
);
</script>
</body>
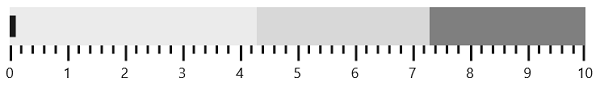
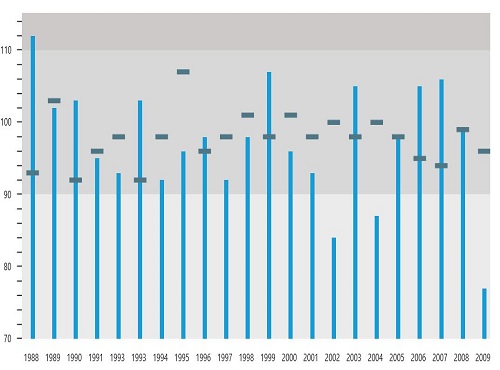
</html>Set Default and Scale Values
You can plot any number of measure bars within the BulletGraph by increasing the height and width of the control to locate all the measure bars within the graph. Set the QualitativeRangeSize and QuantitativeScaleLength properties according to the following code example.
By default, the BulletGraph is rendered in the horizontal orientation with its flow direction set to Forward. In this example, to achieve the desired output, change the horizontal orientation to vertical orientation with the flow direction set to Backward.
Minimum, Maximum and Interval values for the QuantitativeScale of the BulletGraph are set, as illustrated in the following code example. The ticks and labels within the scale are also positioned.
<script type="text/babel">

var quantitativeScaleSettings = {
                minimum: 70,
                maximum: 130,
                interval: 10,
                tickPosition: ej.datavisualization.BulletGraph.TickPosition.Far,
                labelSettings: {
                position: ej.datavisualization.BulletGraph.LabelPosition.Below, offset: 14, size: 10
               },
            };
<!DOCTYPE html>
<html>
    <body>
        <script type="text/babel">
            ReactDOM.render(
                     <div className="default">
                        <EJ.BulletGraph id="bulletGraph1"  quantitativeScaleSettings= {quantitativeScaleSettings} ></EJ.BulletGraph>,
                     </div>,
                     document.getElementById('bulletGraph-default')
                     );
        </script>
    </body>
</html>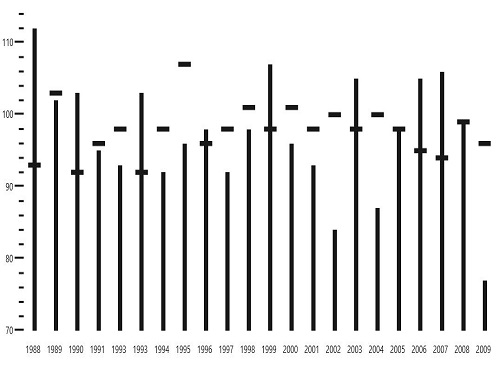
The above image illustrates the BulletGraph without any ranges displayed in the background.
Add Qualitative Ranges
By default, 3 ranges are displayed in the BulletGraph control during the initial rendering of the control with its default values. To customize it, you can set appropriate values for the RangeEnd and RangeStroke properties. Any number of QualitativeRanges can be added to the control.
<script type="text/babel">

var qualitativeRanges= [{
                rangeEnd: 90
                },
                {
                    rangeEnd: 110
                },
                {
                    rangeEnd: 130, rangeStroke: "#CDC9C9"
                }];
<!DOCTYPE html>
<html>
    <body>
        <script type="text/babel">
            ReactDOM.render(
                     <div className="default">
                        <EJ.BulletGraph id="bulletGraph1"   qualitativeRanges={qualitativeRanges} ></EJ.BulletGraph>,
                     </div>,
                     document.getElementById('bulletGraph-default')
                     );
        </script>
    </body>
</html>
After adding QualitativeRanges to the BulletGraph, the control appears as follows.
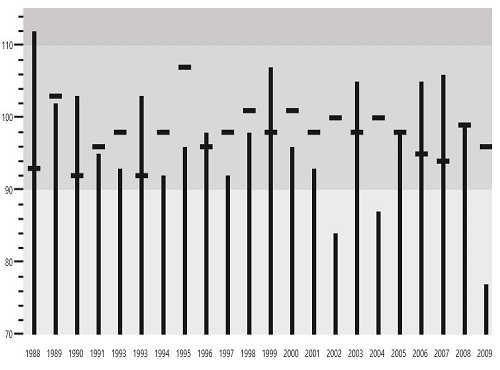
Ticks and Measure Bars Customization
You can do the following code changes in the quantitative scale to customize the tick size, the color of the feature bar and the comparative measure symbols.
<script type="text/babel">

var quantitativeScaleSettings = {
                minimum: 70,
                maximum: 130,
                interval: 10,
                tickPosition: ej.datavisualization.BulletGraph.TickPosition.Far,
                labelSettings: {
                position: ej.datavisualization.BulletGraph.LabelPosition.Below, offset: 14, size: 10
               },
                majorTickSettings:{width:1, size:7},
                minorTickSettings:{width:1},
                comparativeMeasureSettings:{stroke:"#507786"},
                featuredMeasureSettings:{stroke: "#169DD8"}

            };
<!DOCTYPE html>
<html>
    <body>
        <script type="text/babel">
            ReactDOM.render(
                     <div className="default">
                        <EJ.BulletGraph id="bulletGraph1"  quantitativeScaleSettings= {quantitativeScaleSettings} ></EJ.BulletGraph>,
                     </div>,
                     document.getElementById('bulletGraph-default')
                     );
        </script>
    </body>
</html>
When you customize the ticks and measure bar, the BulletGraph appears as follows.
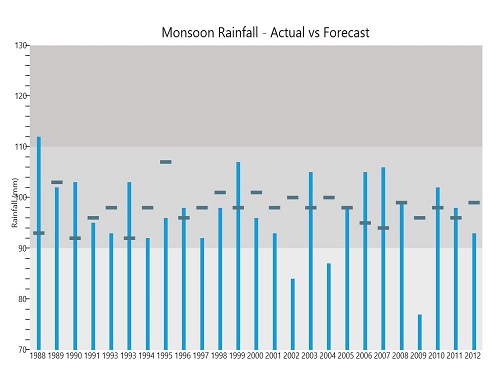
Add Caption and Subtitle
You can add the following code example to display an appropriate Caption and Subtitle to the BulletGraph.
<script type="text/babel">

var captionSettings= {
                textAngle: 0,
                location: { x: 470, y: 270 },
                text: "Monsoon Rainfall - Actual vs Forecast",
                font: { fontFamily: 'Segoe UI', size: '20px', fontWeight: ej.datavisualization.BulletGraph.FontWeight.Normal, opacity: 1 },
                subTitle: {
                 textAngle: -90,
                    text: "Rainfall (mm)", location: { x: 180, y: 4 },
                    font: { fontFamily: 'Segoe UI', size: '14px',
                    fontWeight: 'ej.datavisualization.BulletGraph.FontWeight.Normal', opacity: 1}
                    }
            };
<!DOCTYPE html>
<html>
    <body>
        <script type="text/babel">
            ReactDOM.render(
                     <div className="default">
                        <EJ.BulletGraph id="bulletGraph1"  captionSettings= {captionSettings} ></EJ.BulletGraph>,
                     </div>,
                     document.getElementById('bulletGraph-default')
                     );
        </script>
    </body>
</html>
The following screenshot displays a BulletGraph with a Caption and Subtitle.
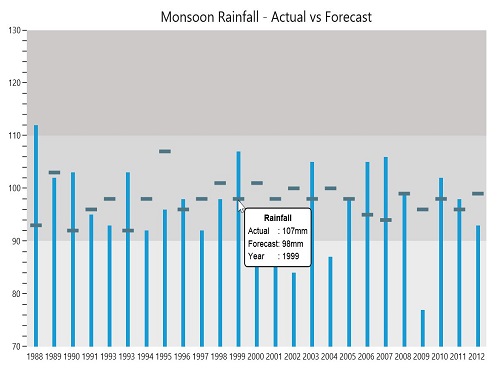
Show Tooltip
You can use a Tooltip in your application to display the values of forecasted rainfall, actual rainfall received in millimeter and also the appropriate year. The Tooltip Visible property is set to true to enable the Tooltip option. To set the template Tooltip, you can pass the template id to it as illustrated in the following code example.
<script type="text/babel">

var tooltipSettings= {template: "Tooltip", visible: true};

<!DOCTYPE html>
<html>
    <body>
        <script type="text/babel">
            ReactDOM.render(
                     <div className="default">
                        <EJ.BulletGraph id="bulletGraph1"   tooltipSettings = {tooltipSettings} ></EJ.BulletGraph>,
                     </div>,
                     document.getElementById('bulletGraph-default')
                     );
        </script>
    </body>
</html><div id="Tooltip"style="display:none; width:125px;padding-top: 10px;padding-bottom:10px">
<div align="center"style="font-weight:bold">
Rainfall </div>
<table>
<tr><td>Actual</td>
<td>: mm</td></tr>
<tr><td>Forecast</td>
<td>: mm</td></tr>
<tr><td>Year</td>
<td>: </td></tr>
</table>
</div>The following screenshot displays a customized BulletGraph.
Without using jsx Template
The BulletGraph can be created from a HTML DIV element with the HTML id attribute set to it. Refer to the following code example.
<div id="bulletGraph-default" style="height:99%;"></div>var localData = [
{
value: 90, comparativeMeasureValue: 100,
category: 2013
},
{
value: 93, comparativeMeasureValue: 99,
category: 2012
},
{
value: 98, comparativeMeasureValue: 96,
category: 2011
},
{
value: 102, comparativeMeasureValue: 98,
category: 2010
},
{
value: 77, comparativeMeasureValue: 96,
category: 2009
},
{
value: 99, comparativeMeasureValue: 99,
category: 2008
},
{
value: 106, comparativeMeasureValue: 94,
category: 2007
},
{
value: 105, comparativeMeasureValue: 95,
category: 2006
},
{
value: 98, comparativeMeasureValue: 98,
category: 2005
},
{
value: 87, comparativeMeasureValue: 100,
category: 2004
},
{
value: 105, comparativeMeasureValue: 98,
category: 2003
},
{
value: 84, comparativeMeasureValue: 101,
category: 2002
},
{
value: 93, comparativeMeasureValue: 98,
category: 2001
},
{
value: 90, comparativeMeasureValue: 96,
category: 2000
},
{
value: 95, comparativeMeasureValue: 107,
category: 1999
},
{
value: 104, comparativeMeasureValue: 98,
category: 1998
},
{
value: 102, comparativeMeasureValue: 92,
category: 1997
},
{
value: 103, comparativeMeasureValue: 98,
category: 1996
},
{
value: 100, comparativeMeasureValue: 96,
category: 1995
},
{
value: 110, comparativeMeasureValue: 92,
category: 1994
},
{
value: 100, comparativeMeasureValue: 103,
category: 1993
},
{
value: 94, comparativeMeasureValue: 93,
category: 1992
},
{
value: 91, comparativeMeasureValue: 95,
category: 1991
},
{
value: 107, comparativeMeasureValue: 103,
category: 1990
},
{
value: 101, comparativeMeasureValue: 102,
category: 1989
},
{
value: 119, comparativeMeasureValue: 112,
category: 1988
}];
var quantitativeScaleSettings = {
minimum: 70,
maximum: 130,
interval: 10,
tickPosition: ej.datavisualization.BulletGraph.TickPosition.Far,
labelSettings: {
position: ej.datavisualization.BulletGraph.LabelPosition.Below, offset: 14, size: 10
},
};
ReactDOM.render(
React.createElement(EJ.BulletGraph, {id: "bulletCore0",
height: 400,
enableAnimation: true,
qualitativeRangeSize: 320,
quantitativeScaleLength: 475,
quantitativeScaleSettings: quantitativeScaleSettings,
fields: fields,
}
),
document.getElementById('bulletGraph-default')
);
</script>The above image illustrates the BulletGraph without any ranges displayed in the background.