Types of axis in .NET MAUI Polar Chart
15 Jul 202611 minutes to read
Polar chart supports the following types of chart axis:
- NumericalAxis
- CategoryAxis
- DateTimeAxis
- DateTimeCategoryAxis
NOTE
Prerequisite: Ensure that the required NuGet package is installed, the necessary namespaces are imported, and the SfPolarChart control is properly configured in your application. For detailed setup and configuration instructions, refer to the Getting Started guide.
Numerical axis
NumericalAxis is used to plot numerical values to the chart. NumericalAxis can be defined for both PrimaryAxis and SecondaryAxis.
<chart:SfPolarChart>
    <!-- code omitted for brevity -->
    <chart:SfPolarChart.PrimaryAxis>
        <chart:NumericalAxis/>
    </chart:SfPolarChart.PrimaryAxis>

    <chart:SfPolarChart.SecondaryAxis>
        <chart:NumericalAxis/>
    </chart:SfPolarChart.SecondaryAxis>
</chart:SfPolarChart>
SfPolarChart chart = new SfPolarChart();
// code omitted for brevity
NumericalAxis primaryAxis = new NumericalAxis();
chart.PrimaryAxis = primaryAxis;
NumericalAxis secondaryAxis = new NumericalAxis();
chart.SecondaryAxis = secondaryAxis;
this.Content = chart;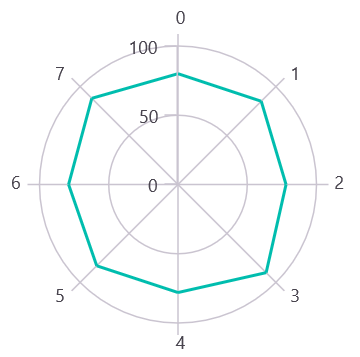
Interval
Axis interval can be customized by using the Interval property. By default, the interval is calculated based on the minimum and maximum value of the provided data.
<chart:SfPolarChart>
    <!-- code omitted for brevity -->
    <chart:SfPolarChart.PrimaryAxis>
        <chart:NumericalAxis Interval = "10"/>
    </chart:SfPolarChart.PrimaryAxis>

    <chart:SfPolarChart.SecondaryAxis>
        <chart:NumericalAxis/>
    </chart:SfPolarChart.SecondaryAxis>
</chart:SfPolarChart>
SfPolarChart chart = new SfPolarChart();
// code omitted for brevity
NumericalAxis primaryAxis = new NumericalAxis()
{
Interval = 10
};
chart.PrimaryAxis = primaryAxis;
NumericalAxis secondaryAxis = new NumericalAxis();
chart.SecondaryAxis = secondaryAxis;
this.Content = chart;Customizing the Range
The Maximum and Minimum properties of the axis are used to set the maximum and minimum values of the axis range, respectively.
NOTE
If either the minimum or maximum value is set, the other value is calculated internally by default.
<chart:SfPolarChart>
    <!-- code omitted for brevity -->
    <chart:SfPolarChart.SecondaryAxis>
        <chart:NumericalAxis Maximum = "100" Minimum = "0" Interval = "20"/>
    </chart:SfPolarChart.SecondaryAxis>
</chart:SfPolarChart>
SfPolarChart chart = new SfPolarChart();
// code omitted for brevity
NumericalAxis secondaryAxis = new NumericalAxis()
{
Maximum = 100,
Minimum = 0,
Interval = 20
};
chart.SecondaryAxis = secondaryAxis;
this.Content = chart;Category axis
The CategoryAxis is an index-based axis that plots values based on the index of the data point collection. The points are equally spaced along the axis.
<chart:SfPolarChart>
    <!-- code omitted for brevity -->
    <chart:SfPolarChart.PrimaryAxis>
        <chart:CategoryAxis/>
    </chart:SfPolarChart.PrimaryAxis>
</chart:SfPolarChart>
SfPolarChart chart = new SfPolarChart();
// code omitted for brevity
CategoryAxis primaryAxis = new CategoryAxis();
chart.PrimaryAxis = primaryAxis;
this.Content = chart;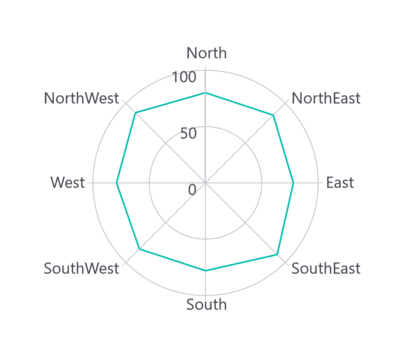
Interval
By default, the CategoryAxis labels are displayed with a fixed interval of 1. This can be customized by using the Interval property of the axis.
<chart:SfPolarChart>
    <!-- code omitted for brevity -->
    <chart:SfPolarChart.PrimaryAxis>
        <chart:CategoryAxis Interval = "2"/>
    </chart:SfPolarChart.PrimaryAxis>

    <chart:SfPolarChart.SecondaryAxis>
        <chart:NumericalAxis/>
    </chart:SfPolarChart.SecondaryAxis>
</chart:SfPolarChart>
SfPolarChart chart = new SfPolarChart();
// code omitted for brevity
CategoryAxis primaryAxis = new CategoryAxis()
{
Interval = 2
};
chart.PrimaryAxis = primaryAxis;
NumericalAxis secondaryAxis = new NumericalAxis();
chart.SecondaryAxis = secondaryAxis;
this.Content = chart;Date time axis
DateTimeAxis is used to plot DateTime values. The DateTimeAxis is widely used to make financial charts in places like the Stock Market, where index plotting is done every day.
<chart:SfPolarChart>
    <!-- code omitted for brevity -->
    <chart:SfPolarChart.PrimaryAxis>
        <chart:DateTimeAxis/>
    </chart:SfPolarChart.PrimaryAxis>
</chart:SfPolarChart>
SfPolarChart chart = new SfPolarChart();
// code omitted for brevity
DateTimeAxis primaryAxis = new DateTimeAxis();
chart.PrimaryAxis = primaryAxis;
this.Content = chart;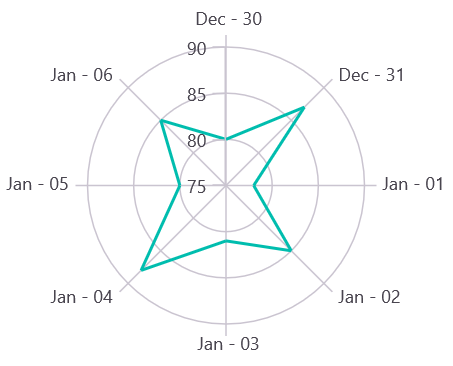
Interval
In DateTimeAxis, intervals can be customized using the Interval and IntervalType properties. For example, setting Interval as 6 and IntervalType as Months will consider 6 months as interval.
<chart:SfPolarChart>
    <!-- code omitted for brevity -->
    <chart:SfPolarChart.PrimaryAxis>
        <chart:DateTimeAxis Interval = "6" IntervalType = "Months"/>
    </chart:SfPolarChart.PrimaryAxis>

    <chart:SfPolarChart.SecondaryAxis>
        <chart:NumericalAxis/>
    </chart:SfPolarChart.SecondaryAxis>
</chart:SfPolarChart>
SfPolarChart chart = new SfPolarChart();
// code omitted for brevity
DateTimeAxis primaryAxis = new DateTimeAxis()
{
Interval = 6,
IntervalType = DateTimeIntervalType.Months
};
chart.PrimaryAxis = primaryAxis;
NumericalAxis secondaryAxis = new NumericalAxis();
chart.SecondaryAxis = secondaryAxis;
this.Content = chart;Customizing the range
The Minimum and Maximum properties behave the same way as in NumericalAxis except that date time values are used instead of numerical values.
<chart:SfPolarChart>
    <!-- code omitted for brevity -->
    <chart:SfPolarChart.PrimaryAxis>
        <chart:DateTimeAxis Minimum = "2021/05/10" Maximum = "2021/11/01"/>
    </chart:SfPolarChart.PrimaryAxis>
</chart:SfPolarChart>
SfPolarChart chart = new SfPolarChart();
// code omitted for brevity
DateTimeAxis primaryAxis = new DateTimeAxis()
{
Minimum = new DateTime(2021, 05, 10),
Maximum = new DateTime(2021, 11, 01)
};
chart.PrimaryAxis = primaryAxis;
this.Content = chart;DateTime category axis
The DateTimeCategoryAxis is a specialized type of axis primarily used with financial series. Similar to the CategoryAxis, all data points are plotted with equal spacing, eliminating gaps for missing dates. The intervals and ranges for this axis are calculated similarly to the DateTimeAxis. There are no visual gaps between points, even if the difference between two points exceeds a year.
<chart:SfPolarChart>
    <!-- code omitted for brevity -->
    <chart:SfPolarChart.PrimaryAxis>
        <chart:DateTimeCategoryAxis/>
    </chart:SfPolarChart.PrimaryAxis>
    <!-- code omitted for brevity -->
</chart:SfPolarChart>
SfPolarChart chart = new SfPolarChart();
// code omitted for brevity
DateTimeCategoryAxis primaryAxis = new DateTimeCategoryAxis();
chart.PrimaryAxis = primaryAxis;
// code omitted for brevity
this.Content = chart;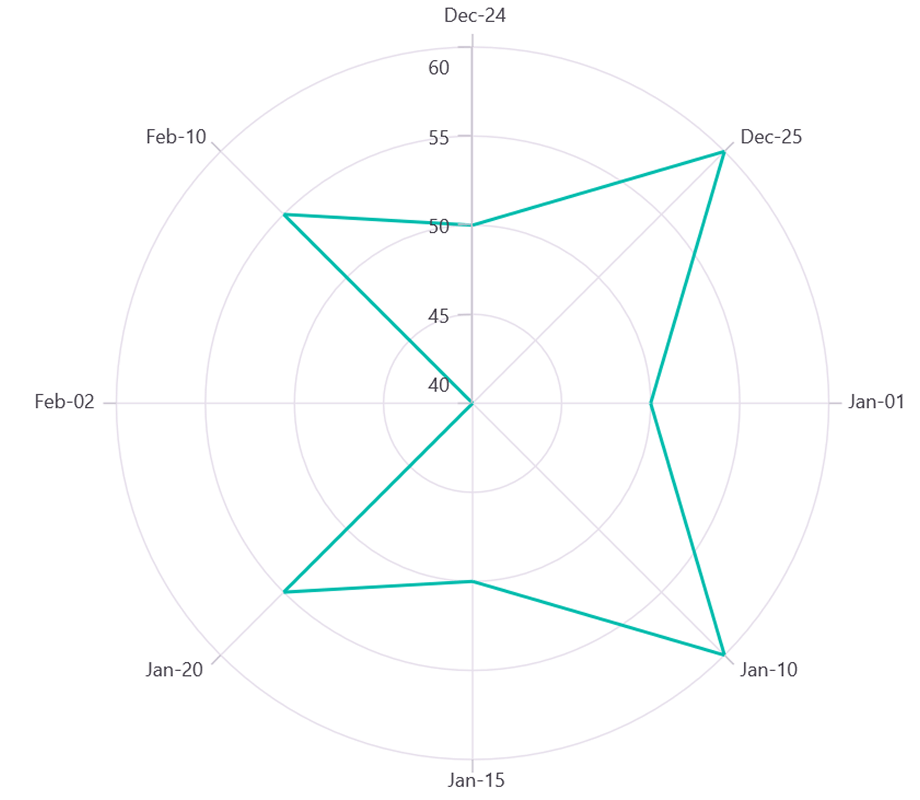
Interval
In DateTimeCategoryAxis, intervals can be customized by using the Interval and IntervalType properties, similar to DateTimeAxis. For example, setting Interval to 3 and IntervalType to Months will consider 3 months as the interval.
<chart:SfPolarChart>
    <!-- code omitted for brevity -->
    <chart:SfPolarChart.PrimaryAxis>
        <chart:DateTimeCategoryAxis Interval = "3"
                                    IntervalType = "Months"/>
    </chart:SfPolarChart.PrimaryAxis>
    <!-- code omitted for brevity -->
</chart:SfPolarChart>
SfPolarChart chart = new SfPolarChart();
// code omitted for brevity
DateTimeCategoryAxis primaryAxis = new DateTimeCategoryAxis()
{
Interval = 3,
IntervalType = DateTimeIntervalType.Months
};
chart.PrimaryAxis = primaryAxis;
// code omitted for brevity
this.Content = chart;Inversed axis
The axis can be inverted by using the IsInversed property. The default value of this property is false.
<chart:SfPolarChart>
    <!-- code omitted for brevity -->
    <chart:SfPolarChart.SecondaryAxis>
        <chart:NumericalAxis IsInversed = "True"/>
    </chart:SfPolarChart.SecondaryAxis>
</chart:SfPolarChart>
SfPolarChart chart = new SfPolarChart();
// code omitted for brevity
NumericalAxis secondaryAxis = new NumericalAxis()
{
IsInversed = true
};
chart.SecondaryAxis = secondaryAxis;
this.Content = chart;Events
ActualRangeChanged
The ActualRangeChanged event is triggered when the actual range of the axis is changed. The argument contains the following information:
- ActualMinimum - used to get the actual minimum value of the axis.
- ActualMaximum - used to get the actual maximum value of the axis.
LabelCreated
The LabelCreated event is triggered when the axis label is created. The argument contains the following information:
- Label - used to get or set the text of the axis label.
- Position - used to get the position of the label.
- LabelStyle - used to customize the appearance of the axis labels.