AI Powered Stock Forecasting in .NET MAUI Cartesian Chart
18 Nov 20188 minutes to read
This guide demonstrates how to build an AI-powered .NET MAUI Cartesian Chart Candle series that forecasts stock prices for the next 45 days, helping traders make informed decisions using Syncfusion controls and Azure OpenAI.
Prerequisite: Ensure that the required NuGet package is installed, the necessary namespaces are imported, and the SfCartesianChart control is properly configured in your application. For detailed setup and configuration instructions, refer to the Getting Started guide.
Integrating Azure OpenAI for Stock Forecasting
Before proceeding, ensure that Azure OpenAI is configured and integrated with your .NET MAUI application. Refer to the Azure OpenAI integration prerequisites and complete the required setup steps.
public async Task<ObservableCollection<CompaniesModel>> GetResultsFromAI(string userPrompt, CompanyInfoRepo viewModel, int index)
{
    try
    {
        if (IsCredentialValid && Client != null)
        {
            ChatHistory = string.Empty;
            // Add the system message and user message to the options
            ChatHistory = ChatHistory + userPrompt;
            var response = await Client.CompleteAsync(ChatHistory);
            return this.ConvertToCompaniesModelCollection(response.ToString());
        }
    }
    catch (Exception)
    {
        return viewModel.GenerateDataSource();
    }

    return viewModel.GenerateDataSource();
}
1. Implement the Syncfusion .NET MAUI Cartesian Chart to display forecasted data.
The Syncfusion .NET MAUI Cartesian Chart Candle series allows you to display financial data. Define the data Model that holds the financial data (High, Low, Open, Close) and ViewModel that holds the collection of data for binding.
//Model

//code omitted for brevity
public class DataModel
{
    public double High { get; set; }
    public double Low { get; set; }
    public DateTime Date { get; set; }
    public double Open { get; set; }
    public double Close { get; set; }
}

// ViewModel

public class ViewModel : INotifyPropertyChanged
{
    private ObservableCollection<DataModel> stockData;
    public ObservableCollection<DataModel> StockData {
       get { return stockData; }
       set
       {
           stockData = value;
           OnPropertyChanged(nameof(StockData));
       }
    }

    // Helps to store and display the Forecast data in view from AI response.
    public ObservableCollection<CompaniesModel> ForeCastData { get; set; }

    public const string msftStockSource = "6/28/2024\t453.07\t455.38\t446.41\t446.95\t28,362,270\r\n6/27/2024\t452.18\t456.17\t451.77\t452.85\t14,806,320\r\n6/26/20..."; // Complete data from CSV file downloaded.

    public event PropertyChangedEventHandler? PropertyChanged;

    public ViewModel()
    {
        stockData = GenerateCollection(msftStockSource);
    }

    private ObservableCollection<DataModel> GenerateCollection(string dataSource)
    {
        string[] alphapetRows = dataSource.Split(new[] { "\r\n", "\n" }, StringSplitOptions.RemoveEmptyEntries);
        ObservableCollection<DataModel> alphabetCollection = new ObservableCollection<DataModel>();

        foreach (string row in alphapetRows)
        {
            string[] columns = row.Split('\t');
            DataModel item = new DataModel(GetDateTime(columns[0]), GetDouble(columns[2]), GetDouble(columns[3]), GetDouble(columns[1]), GetDouble(columns[4]));
            alphabetCollection.Add(item);
        }

        return alphabetCollection;
    }
}
2. Display Data Using Syncfusion Cartesian Chart
Bind your ViewModel to the chart and display both historical and forecasted data:
<!-- code omitted for brevity -->
<chart:SfCartesianChart x:Name="chart" >

 <chart:SfCartesianChart.XAxes>
  <chart:DateTimeAxis x:Name="dateTime" LabelExtent="30" IntervalType="Months" ShowMajorGridLines="False" >
 </chart:SfCartesianChart.XAxes>

 <chart:SfCartesianChart.YAxes>
   <chart:NumericalAxis EdgeLabelsVisibilityMode="AlwaysVisible"  EdgeLabelsDrawingMode="Center">
   </chart:NumericalAxis>
 </chart:SfCartesianChart.YAxes>

 <chart:CandleSeries x:Name="candleSeries" ItemsSource="{Binding StockData}"
                      XBindingPath="Date"
                      Open="Open"
                      High="High"
                      Low="Low"
                      Close="Close" />

 <chart:CandleSeries x:Name="forecastCandle"
                      ItemsSource="{Binding ForeCastData}"
                      XBindingPath="Date"
                      Open="Open"
                      High="High"
                      Low="Low"
                      Close="Close"   />

</chart:SfCartesianChart>
3. Trigger AI Forecasting
Invoke the AI service when the user clicks a button:
private async void AIButtonClicked(object sender, EventArgs e)
{
   AzureOpenAIService service = new AzureOpenAIService();
   var data = viewModel.StockData;
   var last10Items = data.Skip(Math.Max(0, data.Count - 10)).Take(10).ToList();

   //Build a prompt for AI.
   var prompt = service.GeneratePrompt(last10Items);
   var value = await service.GetAnswerFromGPT(prompt, viewModel, selected_Index);

   //Update forecast value to chart.
   await viewModel.AddRangeWithDelayAsync(value, 300);
}
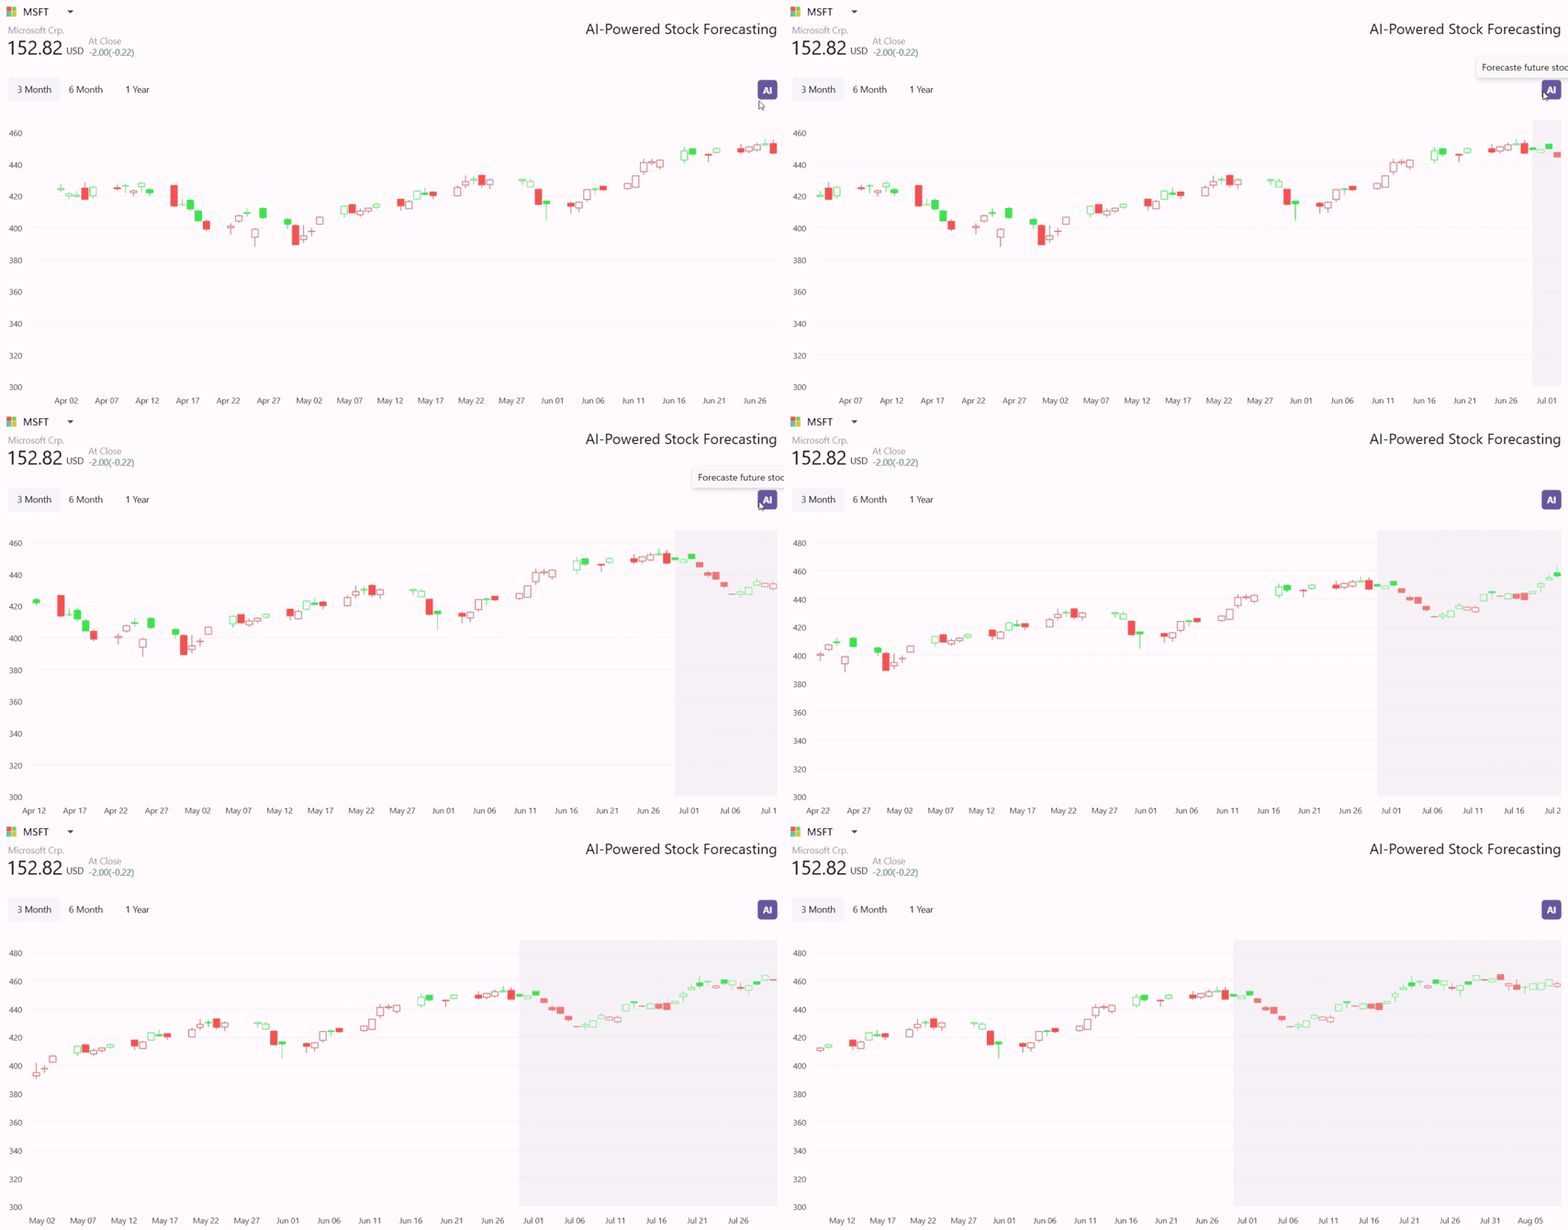
After receiving the AI-predicted stock trends, the chart updates to display both historical and forecasted data, providing a visual representation of potential market movements.
The following image demonstrates the output of the above AI powered stock forecasting .NET MAUI Cartesian Chart.
For more information, please visit the GitHub Sample