About Syncfusion® .NET MAUI Polar Chart Control
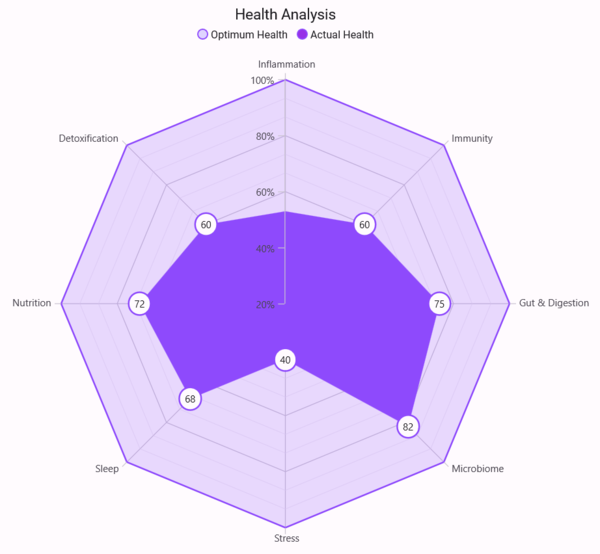
The Syncfusion® .NET MAUI Polar Chart allows for the creation of visually stunning polar series for data visualization in high-quality applications. This chart type, commonly known as a radar or spider chart, effectively represents data in terms of values and angles.
Business use cases
- Analytical applications that require comparison of multiple data points across categories using radar or spider charts.
- Performance dashboards that display multidimensional data such as KPIs, scores, or metrics.
- Financial and business applications that track relative values and distribution using angular visualization.
- Scientific and research applications that require visualizing cyclic or angular data patterns.
Key features
- Polar series visualization allows displaying data using line and area series in a radial layout.
- Multiple series allows comparing different datasets simultaneously within a single chart.
- Axis angle customization allows adjusting polar axis positions to angles such as 0, 90, 180, and 270 degrees.
- Gridline customization allows switching between circular and polygon grid styles for different chart representations.
- Rich customization allows configuring chart elements such as axes, titles, data labels, markers, and tooltips.
Globalization
The following table summarizes the globalization support available in this control.
 Full Support
 Partial Support
 Not Applicable
 No Support
| Control | Localization | RTL | Time zone | Screen reader | Keyboard navigation |
|---|---|---|---|---|---|
| Polar Charts | |
|
|
|
|
Related controls
- Cartesian Charts for visualizing data using line, column, and bar charts.
- Circular Charts for representing proportional data using pie and doughnut charts.
- Funnel Charts for visualizing process stages and conversion flows.
See Also
- Getting Started shows a step‑by‑step guide to begin using the Polar Chart control.
- Chart Types explores different polar chart types.
- Customization explains how to customize appearance and interaction settings.
- UI Kit provides interactive demos and ready‑made UI examples.
Resources
Feature Tour
Get a quick overview of key features and capabilities to kick start your journey.
Explore Features
Tutorial Videos
Watch step‑by‑step video guides to quickly understand concepts and implementation.
Watch now
Knowledge Base
Find practical solutions, troubleshooting tips and how‑to guides for common scenarios.
Search KB's