Getting Started with .NET MAUI Polar Chart
This section explains how to populate the Polar chart with data, a title, data labels, a legend, tooltips, and markers. It also covers the essential aspects of getting started with the chart.
To get started quickly with our .NET MAUI Polar Chart, you can check the below video.
Prerequisites
Before proceeding, ensure the following are set up:
- Install .NET 9 SDK or later.
- Set up a .NET MAUI environment with Visual Studio 2022 v17.12 or later.
Step 1: Create a new .NET MAUI project
- Go to File > New > Project and choose the .NET MAUI App template.
- Name the project and choose a location. Then, click Next.
- Select the .NET framework version and click Create.
Step 2: Install the Syncfusion® MAUI Toolkit NuGet package
- In Solution Explorer, right-click the project and choose Manage NuGet Packages.
- Search for Syncfusion.Maui.Toolkit and install the latest version.
- Ensure the necessary dependencies are installed correctly, and the project is restored.
Prerequisites
Before proceeding, ensure the following are set up:
- Install .NET 9 SDK or later.
- Set up a .NET MAUI environment with Visual Studio Code.
- Ensure that the .NET MAUI workloads are installed and configured as described here.
Step 1: Create a new .NET MAUI project
- Open the Command Palette by pressing Ctrl+Shift+P and type .NET:New Project and press Enter.
- Choose the .NET MAUI App template.
- Select the project location, type the project name and press Enter.
- Then choose Create project
Step 2: Install the Syncfusion® MAUI Toolkit NuGet package
- Press Ctrl + ` (backtick) to open the integrated terminal in Visual Studio Code.
- Ensure you’re in the project root directory where your .csproj file is located.
- Run the command
dotnet add package Syncfusion.Maui.Chartsto install the Syncfusion® .NET MAUI Charts package. - To ensure all dependencies are installed, run
dotnet restore.
Prerequisites
Before proceeding, ensure the following are set up:
- Install .NET 9 SDK or later.
- Set up a .NET MAUI environment with JetBrains Rider 2024.3 or later.
- Make sure the MAUI workloads are installed and configured as described here.
Step 1: Create a new .NET MAUI project
- Go to File > New Solution, Select .NET (C#) and choose the .NET MAUI App template.
- Enter the Project Name, Solution Name, and Location.
- Select the .NET framework version and click Create.
Step 2: Install the Syncfusion® MAUI Toolkit NuGet package
- In Solution Explorer, right-click the project and choose Manage NuGet Packages.
- Search for Syncfusion.Maui.Toolkit and install the latest version.
- Ensure the necessary dependencies are installed correctly, and the project is restored. If not, Open the Terminal in Rider and manually run:
dotnet restore
Step 3: Register Syncfusion handler
Make sure to add the namespace.
using Syncfusion.Maui.Toolkit.Hosting;Register the Syncfusion core handler in your CreateMauiApp method of MauiProgram.cs file to use Syncfusion controls.
public static class MauiProgram
{
    public static MauiApp CreateMauiApp()
    {
        var builder = MauiApp.CreateBuilder();
        builder
            .UseMauiApp<App>()
            .ConfigureSyncfusionToolkit()
            .ConfigureFonts(fonts =>
            {
                fonts.AddFont("OpenSans-Regular.ttf", "OpenSansRegular");
                fonts.AddFont("OpenSans-Semibold.ttf", "OpenSansSemibold");
            });

#if DEBUG
        builder.Logging.AddDebug();
#endif

        return builder.Build();
    }
}
Step 4: Initialize the view model
Now, let us define a simple data model that represents a data point on the chart.
public class PlantModel
{
    public string Direction { get; set; }
    public double Tree { get; set; }
    public double Flower { get; set; }
    public double Weed { get; set; }
}
Data model properties:
-
Direction- Category name displayed on the primary axis (N, NE, E, SE, etc.) -
Tree,Flower,Weed- Numeric values plotted on the secondary (radial) axis for each direction
Next, create a PlantViewModel class and initialize a list of PlantModel objects as follows.
public class PlantViewModel
{
    public List<PlantModel> PlantDetails { get; set; }
    public PlantViewModel()
    {
        PlantDetails = new List<PlantModel>()
        {
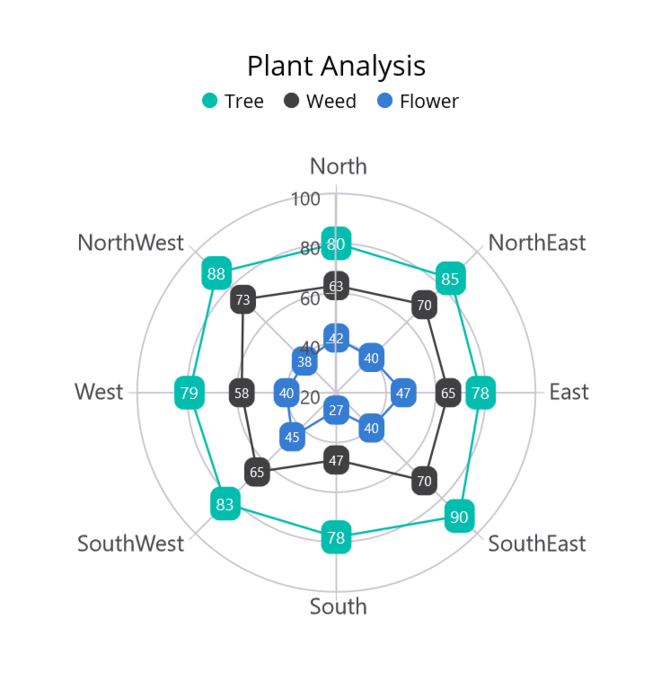
            new PlantModel(){ Direction = "North", Tree = 80, Flower = 42, Weed = 63},
            new PlantModel(){ Direction = "NorthEast", Tree = 85, Flower = 40, Weed = 70},
            new PlantModel(){ Direction = "East", Tree = 78 , Flower = 47, Weed = 65},
            new PlantModel(){ Direction = "SouthEast", Tree = 90 , Flower = 40, Weed = 70},
            new PlantModel(){ Direction = "South", Tree = 78 , Flower = 27, Weed = 47},
            new PlantModel(){ Direction = "SouthWest", Tree = 83 , Flower = 45, Weed = 65},
            new PlantModel(){ Direction = "West", Tree = 79 , Flower = 40, Weed = 58},
            new PlantModel(){ Direction = "NorthWest", Tree = 88 , Flower = 38, Weed = 73}
        };
    }
}
Step 5: Import the Charts namespace
Add the following namespace in your XAML or C#.
xmlns:chart = "clr-namespace:Syncfusion.Maui.Toolkit.Charts;assembly=Syncfusion.Maui.Toolkit.Charts"using Syncfusion.Maui.Toolkit.Charts;Step 6: Populate Chart with data
Initialize the SfPolarChart and you can add a PolarLineSeries to the polar chart Series property of the chart, and then bind the PlantDetails property of the above PlantViewModel to the PolarLineSeries.ItemsSource as follows.
In order to plot the series, the XBindingPath and YBindingPath properties need to be configured correctly. These properties allow the chart to retrieve values from the corresponding properties in the data model.
<chart:SfPolarChart>
    <chart:SfPolarChart.Title>
        <Label Text = "Plant Analysis" HorizontalTextAlignment = "Center"/>
    </chart:SfPolarChart.Title>
    <chart:SfPolarChart.Legend>
        <chart:ChartLegend/>
    </chart:SfPolarChart.Legend>
    <chart:SfPolarChart.PrimaryAxis>
        <chart:CategoryAxis/>
    </chart:SfPolarChart.PrimaryAxis>
    <chart:SfPolarChart.SecondaryAxis>
        <chart:NumericalAxis Maximum = "100"/>
    </chart:SfPolarChart.SecondaryAxis>
    <chart:PolarLineSeries ItemsSource = "{Binding PlantDetails}" XBindingPath = "Direction" YBindingPath = "Tree"
                           Label = "Tree" EnableTooltip = "True" ShowDataLabels = "True"/>
    <chart:PolarLineSeries ItemsSource = "{Binding PlantDetails}" XBindingPath = "Direction" YBindingPath = "Weed"
                           Label = "Weed" EnableTooltip = "True" ShowDataLabels = "True"/>
    <chart:PolarLineSeries ItemsSource = "{Binding PlantDetails}" XBindingPath = "Direction" YBindingPath = "Flower"
                           Label = "Flower" EnableTooltip = "True" ShowDataLabels = "True"/>
</chart:SfPolarChart>
SfPolarChart chart = new SfPolarChart();
chart.Title = new Label()
{
Text = "Plant Analysis",
HorizontalTextAlignment = TextAlignment.Center
};
CategoryAxis primaryAxis = new CategoryAxis();
chart.PrimaryAxis = primaryAxis;
NumericalAxis secondaryAxis = new NumericalAxis()
{
Maximum = 100,
};
chart.SecondaryAxis = secondaryAxis;
PolarLineSeries series1 = new PolarLineSeries()
{
ItemsSource = (new PlantViewModel()).PlantDetails,
XBindingPath = "Direction",
YBindingPath = "Tree",
Label = "Tree",
EnableTooltip = true,
ShowDataLabels = true,
};
PolarLineSeries series2 = new PolarLineSeries()
{
ItemsSource = (new PlantViewModel()).PlantDetails,
XBindingPath = "Direction",
YBindingPath = "Weed",
Label = "Weed",
EnableTooltip = true,
ShowDataLabels = true,
};
PolarLineSeries series3 = new PolarLineSeries()
{
ItemsSource = (new PlantViewModel()).PlantDetails,
XBindingPath = "Direction",
YBindingPath = "Flower",
Label = "Flower",
EnableTooltip = true,
ShowDataLabels = true
};
chart.Series.Add(series1);
chart.Series.Add(series2);
chart.Series.Add(series3);The following chart is created as a result of the previous code:
You can download the Polar Chart Getting Started sample from GitHub.