Contact Support
Getting started
9 Mar 20182 minutes to read
This section explains how to populate the pivot tree map in your application with JSP wrapper classes of EJ controls. This section covers only the minimal features that are needed to get started with the pivot tree map.
Create pivot tree map widget
You can create a JSP application and add necessary scripts and styles with the help of the given JSP Getting Started Documentation.
Refer to the required scripts and CSS files in your JSP page as mentioned below to render the pivot tree map control:
<!DOCTYPE html>
<html>
<head>
<title>Getting Started - PivotTreeMap</title>
<link href="http://cdn.syncfusion.com/28.1.33/js/web/flat-azure/ej.web.all.min.css" rel="stylesheet" />
<link href="http://cdn.syncfusion.com/28.1.33/js/web/responsive-css/ej.responsive.css" rel="stylesheet" />
<script src="http://cdn.syncfusion.com/js/assets/external/jquery-3.0.0.min.js"></script>
<script src="http://cdn.syncfusion.com/js/assets/external/jsrender.min.js"></script>
<script src="http://cdn.syncfusion.com/28.1.33/js/web/ej.web.all.min.js"></script>
</head>
<body>
<?jsp require_once 'EJ\AutoLoad.jsp'; ?>
</body>
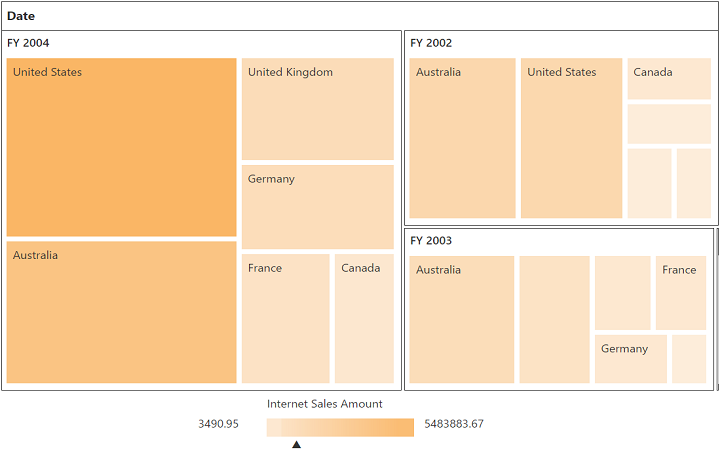
</html>Add the following code example to add list of items to the pivot tree map and initialize the pivot tree map widget with OLAP data source.
<div class="cols-sample-area">
<ej:pivotTreeMap id="PivotTreeMap1">
<ej:pivotTreeMap-dataSource catalog="Adventure Works DW 2008 SE" cube="Adventure Works" data="//bi.syncfusion.com/olap/msmdpump.dll">
<ej:pivotTreeMap-dataSource-rowCollections>
<ej:pivotTreeMap-dataSource-rows fieldName="[Date].[Fiscal]"></ej:pivotTreeMap-dataSource-rows>
</ej:pivotTreeMap-dataSource-rowCollections>
<ej:pivotTreeMap-dataSource-columnCollections>
<ej:pivotTreeMap-dataSource-columns fieldName="[Customer].[Customer Geography]"></ej:pivotTreeMap-dataSource-columns>
</ej:pivotTreeMap-dataSource-columnCollections>
<ej:pivotTreeMap-dataSource-valueCollections>
<ej:pivotTreeMap-dataSource-values axis="columns">
<ej:pivotTreeMap-dataSource-values-measureCollections>
<ej:pivotTreeMap-dataSource-values-measure fieldName="[Measures].[Internet Sales Amount]"></ej:pivotTreeMap-dataSource-values-measure>
</ej:pivotTreeMap-dataSource-values-measureCollections>
</ej:pivotTreeMap-dataSource-values>
</ej:pivotTreeMap-dataSource-valueCollections>
</ej:pivotTreeMap-dataSource>
</ej:pivotTreeMap>
</div>
<script id="tooltipTemplate" type="application/jsrender">
	<div style="background:White; color:black; font-size:12px; font-weight:normal; border: 1px solid #4D4D4D; white-space: nowrap;border-radius: 2px; margin-right: 25px; min-width: 110px;padding-right: 5px; padding-left: 5px; padding-bottom: 2px ;width: auto; height: auto;">
		<div>Measure(s) : </div><div>Row : </div><div>Column : </div><div>Value : </div>
	</div>
</script>
The above code will generate a simple pivot tree map with internet sales amount over a period of fiscal years across different customer geographic locations.