How can I help you?
Getting started with JavaScript PivotChart
Creating a simple application with pivot chart and OLAP data sources (client mode)
This section covers the information required to populate a simple pivot chart with the OLAP data completely on the client-side.
Scripts and CSS references
Create an HTML page and add scripts and style sheets that are required to render a pivot chart widget which are highlighted below in an appropriate order:
- ej.web.all.min.css
- jQuery-3.0.0.min.js
- ej.web.all.min.js
Initialize pivot chart
Place a “div” tag in the HTML page which acts as a container for the pivot chart widget. Then, initialize the widget by using the “ejPivotChart” method.
<!DOCTYPE html>
<html>
    <head>
        <title>PivotChart - Getting Started</title>
        <link href="http://cdn.syncfusion.com/33.1.44/js/web/flat-azure/ej.web.all.min.css" rel="stylesheet" type="text/css" />
        <script src="http://cdn.syncfusion.com/js/assets/external/jquery-3.0.0.min.js" type="text/javascript"></script>
        <script src="http://cdn.syncfusion.com/33.1.44/js/web/ej.web.all.min.js" type="text/javascript"></script>
    </head>
    <body>
        <!--Create a tag which acts as a container for ejPivotChart widget.-->
        <div id="PivotChart1" style="width: 800px; height: 350px"></div>
        <script type="text/javascript">
            $(function () {
                //Set properties and initialize ejPivotChart widget.
                $("#PivotChart1").ejPivotChart();
            });
        </script>
    </body>
</html>
Populate pivot chart with data source
Initialize the OLAP data source for pivot chart widget as shown below:
<html>
//....
<body>
<div id="PivotChart1" style="width: 800px; height: 350px"></div>
<script type="text/javascript">
$(function() {
$("#PivotChart1").ejPivotChart({
dataSource: {
data: "https://bi.syncfusion.com/olap/msmdpump.dll",
catalog: "Adventure Works DW 2008 SE",
cube: "Adventure Works",
rows: [{
fieldName: "[Date].[Fiscal]"
}],
columns: [{
fieldName: "[Customer].[Customer Geography]"
}],
values: [{
measures: [{
fieldName: "[Measures].[Internet Sales Amount]",
}],
axis: "columns"
}]
},
size: {
height: "350px",
width: "800px"
}
});
});
</script>
</body>
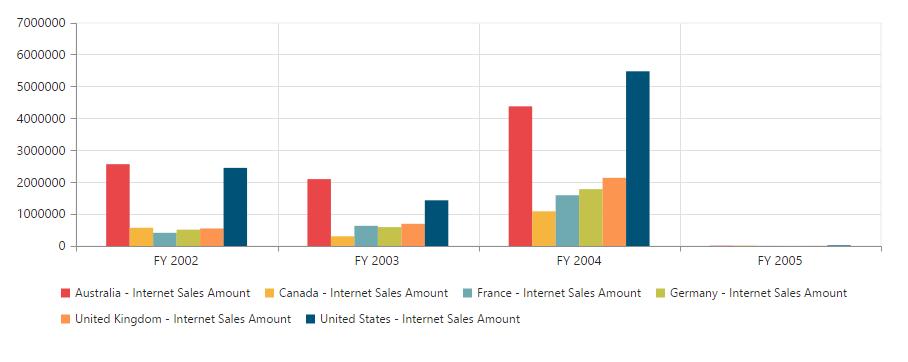
</html>The above code will generate a simple pivot chart showing internet sales amount over a period of fiscal years across different customer geographic locations.
The following table will explain the OLAP datasource properties at client-side in detail:
| Properties | Description | ||||||||||
|---|---|---|---|---|---|---|---|---|---|---|---|
| Contains the respective cube name as string type in the OLAP database. | |||||||||||
| To set the data source name to fetch the data. | |||||||||||
| Sets the provider name for PivotGrid to identify whether the provider is SSAS or Mondrian. | |||||||||||
| Provides the raw data source for the PivotGrid. | |||||||||||
| In connection with an OLAP database, this property contains the database name as string to fetch the data from the given connection string. | |||||||||||
Lists out the items to be arranged in the columns section of the PivotGrid.
|
|||||||||||
Lists out the items to be arranged in the rows section of PivotGrid.
|
|||||||||||
Lists out the items to be arranged in the rows section of PivotGrid.
|
Creating a simple application with pivot chart and OLAP data source (server mode)
This section covers the information required to create a simple pivot chart bound to the OLAP data source.
NOTE
This section is illustrated by creating a simple web application through the Visual Studio IDE since the pivot chart in server mode requires .NET dependency. The web application contains an HTML page and a service that will transfer the data to
server-side, process it, and return it to theclient-sidefor control rendering. The service utilized for communication can be either WCF or WebAPI based on user requirement. Here, both are illustrated for user convenience.
Project initialization
Create a new ASP.NET Empty Web Application by using the Visual Studio IDE and name the project “PivotChartDemo”.
Next, you can add an HTML page. To add an HTML page in your web application, right-click the project in the solution explorer and select Add > New Item. In the Add New Item window, select HTML Page and name it “GettingStarted.html,” and then click Add.
Now, you can set the “GettingStarted.html” as start-up page. To do so, right-click the “GettingStarted.html” page and select “Set As Start Page”.
Scripts and CSS initialization
The scripts and style sheets that are required to render a pivot chart widget in the HTML page are highlighted below in an appropriate order:
This section covers the information required to create a simple pivot chart bound to the OLAP data source.
NOTE
This section is illustrated by creating a simple web application through the Visual Studio IDE since the pivot chart in server mode requires .NET dependency. The web application contains an HTML page and a service that will transfer data to server-side, process it, and return it client-side for control rendering. The service utilized for communication can be either WCF or WebAPI based on user requirement. Both are illustrated here for user convenience.
Project initialization
Create a new ASP.NET Empty Web Application by using the Visual Studio IDE and name the project “PivotChartDemo.”
Next, you should add an HTML page. To add an HTML page in your web application, right-click the project in the solution explorer and select Add > New Item. In the Add New Item window, select HTML Page and name it “GettingStarted.html,” and then click Add.
Now, you can set the “GettingStarted.html” page as start-up page. To do so, right-click “GettingStarted.html” page and select “Set As Start Page.”
Scripts and CSS initialization
The scripts and style sheets that are required to render a pivot chart widget in an HTML page are highlighted below in an appropriate order:
- ej.web.all.min.css
- jQuery-3.0.0.min.js
- ej.web.all.min.js
The scripts and style sheets listed above can be found in any of the following locations:
Local disk: Click here to know more about script and style sheets installed on the local machine.
CDN link: Click here to know more about script and style sheets available in online.
NuGet package: Click here to know more about script and style sheets available in the NuGet package.
Control initialization
To initialize a pivot chart widget, first you can define a “div” tag with an appropriate “id” attribute which acts as a container for the pivot chart widget. Then, you can initialize the widget by using the ejPivotChart method.
<!DOCTYPE html>
<html xmlns="http://www.w3.org/1999/xhtml">
    <head>
        <title>PivotChart - Getting Started</title>
        <link href="http://cdn.syncfusion.com/33.1.44/js/web/flat-azure/ej.web.all.min.css" rel="stylesheet" type="text/css" />
        <script src="http://cdn.syncfusion.com/js/assets/external/jquery-3.0.0.min.js" type="text/javascript"></script>
        <script src="http://cdn.syncfusion.com/33.1.44/js/web/ej.web.all.min.js" type="text/javascript"></script>
    </head>

    <body>
        <!--Create a tag which acts as a container for ejPivotChart widget.-->
        <div id="PivotChart1" style="width: 800px; height: 350px"> </div>
        <script type="text/javascript">
            //Set properties and initialize ejPivotChart widget.
            $(function() {
                $("#PivotChart1").ejPivotChart({
                    url: "/Olap",
                    size: {
                        height: "350px",
                        width: "800px"
                    }
                });
            });
        </script>
    </body>
</html>
The url property in the pivot chart widget points the service endpoint, where the data is processed and fetched in the form of JSON. The services used for the pivot chart widget as endpoint are WCF and WebAPI.
NOTE
The above “GettingStarted.html” contains WebAPI URL, which is “/Olap”. If you are using the WCF service, then the URL will look like “/OlapService.svc”.
Register the referenced assemblies in “Web.config” file available at the root of the application.
<compilation debug="true" targetFramework="4.5.1">
    <assemblies>
        ……
        ……
        <add assembly="Syncfusion.EJ, Version= 33.1450.44, Culture=neutral, PublicKeyToken=3d67ed1f87d44c89" />
        <add assembly="Syncfusion.EJ.Pivot, Version= 33.1450.44, Culture=neutral, PublicKeyToken=3d67ed1f87d44c89" />
        <add assembly="Syncfusion.EJ.Export, Version= 33.1450.44, Culture=neutral, PublicKeyToken=3d67ed1f87d44c89" />
        <add assembly="Syncfusion.Linq.Base, Version= 33.1450.44, Culture=neutral, PublicKeyToken=3d67ed1f87d44c89" />
        <add assembly="Syncfusion.Olap.Base, Version= 33.1450.44, Culture=neutral, PublicKeyToken=3d67ed1f87d44c89" />
        <add assembly="Syncfusion.Compression.Base, Version= 33.1450.44, Culture=neutral, PublicKeyToken=3d67ed1f87d44c89" />
        <add assembly="Syncfusion.PivotAnalysis.Base, Version= 33.1450.44, Culture=neutral, PublicKeyToken=3d67ed1f87d44c89" />
        <add assembly="Syncfusion.Pdf.Base, Version= 33.1450.44, Culture=neutral, PublicKeyToken=3d67ed1f87d44c89" />
        <add assembly="Syncfusion.XlsIO.Base, Version= 33.1450.44, Culture=neutral, PublicKeyToken=3d67ed1f87d44c89" />
        <add assembly="Syncfusion.DocIO.Base, Version= 33.1450.44, Culture=neutral, PublicKeyToken=3d67ed1f87d44c89" />
    </assemblies>
</compilation>
WebAPI
Adding a WebAPI controller
To add a WebAPI controller in your existing web application, right-click the project in the solution explorer and select Add > New Item. In the Add New Item window, select WebAPI Controller Class and name it “OlapController.cs,” and then click Add.
The WebAPI controller is added to your application, which, in-turn, comprises the following file. The utilization of this file will be explained in the following sections.
- OlapController.cs
NOTE
While adding the WebAPI controller class, add the mandatory suffix “Controller.” For example, in the demo, the controller is named “OlapController”.
Next, remove all existing methods such as “Get”, “Post”, “Put”, and “Delete” present in the OlapController.cs file.
namespace PivotChartDemo
{
    public class OlapController : ApiController
    {

    }
}
List of dependency libraries
Next, you can add the below mentioned dependency libraries to your web application. These libraries can be found in the GAC (Global Assembly Cache).
To add them to your web application, right-click References in the solution explorer and select Add Reference. In the Reference Manager dialog, under Assemblies > Extension, the following Syncfusion libraries are found.
NOTE
If you have installed any version of SQL Server Analysis Service (SSAS) or Microsoft ADOMD.NET utility, then the location of Microsoft.AnalysisServices.AdomdClient library is [system drive:\Program Files (x86)\Microsoft.NET\ADOMD.NET]. If you have installed any version of Essential Studio, then the location of Syncfusion libraries is [system drive:\Program Files (x86)\Syncfusion\Essential Studio\33.1.44\Assemblies].
- Microsoft.AnalysisServices.AdomdClient
- Syncfusion.Compression.Base
- Syncfusion.Linq.Base
- Syncfusion.Olap.Base
- Syncfusion.PivotAnalysis.Base
- Syncfusion.XlsIO.Base
- Syncfusion.Pdf.Base
- Syncfusion.DocIO.Base
- Syncfusion.EJ
- Syncfusion.EJ.Pivot
- Syncfusion.EJ.Export
List of namespaces
Following are the list of namespaces to be added on top of the main class in the OlapController.cs file:
using Syncfusion.Olap.Manager;
using Syncfusion.Olap.Reports;
using Syncfusion.JavaScript;

namespace PivotChartDemo
{
    public class OlapController : ApiController
    {

    }
}
Data source initialization
Now, the connection string to connect OLAP cube and pivot chart instances is created immediately in the main class of the OlapController.cs file.
namespace PivotChartDemo
{
    public class OlapController : ApiController
    {
        string connectionString = "Data Source=https://bi.syncfusion.com/olap/msmdpump.dll; Initial Catalog=Adventure Works DW 2008 SE;";
        PivotChart pivotChart = new PivotChart();
        //Other codes
    }
}
Service methods in WebAPI controller
Now, you can define the service methods in the OlapController class. To do this, find the OlapController.cs file which was created while adding the WebAPI controller class to your web application.
namespace PivotChartDemo
{
    public class OlapController : ApiController
    {
        string connectionString = "Data Source=https://bi.syncfusion.com/olap/msmdpump.dll; Initial Catalog=Adventure Works DW 2008 SE;";
        PivotChart pivotChart = new PivotChart();

        [System.Web.Http.ActionName("InitializeChart")]
        [System.Web.Http.HttpPost]
        public Dictionary<string, object> InitializeChart(Dictionary<string, object> jsonResult)
        {
            OlapDataManager DataManager = new OlapDataManager(connectionString);
            DataManager.SetCurrentReport(CreateOlapReport());
            return pivotChart.GetJsonData(jsonResult["action"].ToString(), DataManager);
        }

        [System.Web.Http.ActionName("DrillChart")]
        [System.Web.Http.HttpPost]
        public Dictionary<string, object> DrillChart(Dictionary<string, object> jsonResult)
        {
            OlapDataManager DataManager = new OlapDataManager(connectionString);
            DataManager.SetCurrentReport(Syncfusion.JavaScript.Olap.Utils.DeserializeOlapReport(jsonResult["olapReport"].ToString()));
            return pivotChart.GetJsonData(jsonResult["action"].ToString(), DataManager, jsonResult["drilledSeries"].ToString());
        }

        private OlapReport CreateOlapReport()
        {
            OlapReport olapReport = new OlapReport();
            olapReport.Name = "Default Report";
            olapReport.CurrentCubeName = "Adventure Works";

            DimensionElement dimensionElementColumn = new DimensionElement();
            //Specifying the Name for the Dimension Element
            dimensionElementColumn.Name = "Customer";
            dimensionElementColumn.AddLevel("Customer Geography", "Country");

            MeasureElements measureElementColumn = new MeasureElements();
            //Specifying the Name for the Measure Element
            measureElementColumn.Elements.Add(new MeasureElement { Name = "Customer Count" });

            DimensionElement dimensionElementRow = new DimensionElement();
            //Specifying the Dimension Name
            dimensionElementRow.Name = "Date";
            dimensionElementRow.AddLevel("Fiscal", "Fiscal Year");

            ///Adding Row Members
            olapReport.SeriesElements.Add(dimensionElementRow);
            ///Adding Column Members
            olapReport.CategoricalElements.Add(dimensionElementColumn);
            ///Adding Measure Element
            olapReport.CategoricalElements.Add(measureElementColumn);
            return olapReport;
        }
    }
}
Configure routing in global application class
To add a Global.asax in your existing web application, right-click the project in the solution explorer and select Add > New Item. In the Add New Item window, select Global Application Class and name it “Global.asax”, and then click Add.
After adding the Global.asax file, immediately add the namespace “using System.Web.Http;”, and then configure the routing as shown in the following code example:
public class Global : System.Web.HttpApplication
{
protected void Application_Start(object sender, EventArgs e)
{
GlobalConfiguration.Configuration.Routes.MapHttpRoute(
name: "DefaultApi",
routeTemplate: "{controller}/{action}/{id}",
defaults: new { id = RouteParameter.Optional });
AppDomain.CurrentDomain.SetData("SQLServerCompactEditionUnderWebHosting", true);
}
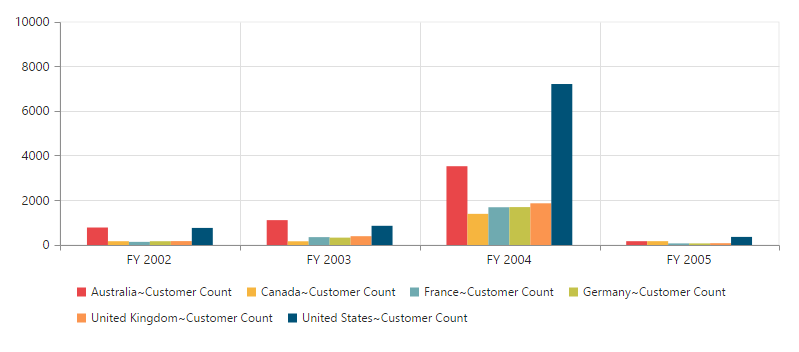
}The pivot chart will be rendered with customer count over a period of fiscal years across different customer geographic locations.
WCF
This section demonstrates the utilization of the WCF service as an endpoint binding the OLAP data source to the simple pivot chart. For more details on this topic, click here.