Overview of Syncfusion Flutter Charts
Syncfusion Flutter Charts is a data visualization library written natively in Dart for creating beautiful and high-performance charts, which are used to craft high-quality mobile app user interfaces using Flutter.
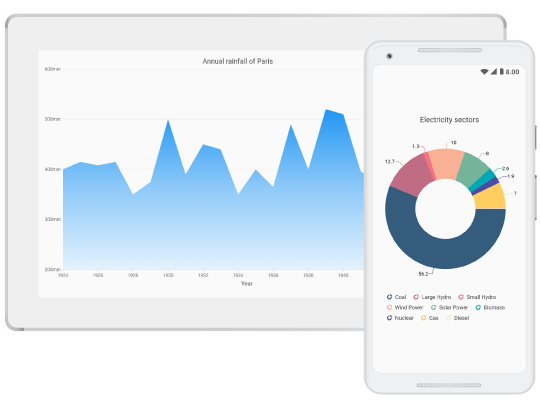
Key Features
- Supports more than 3 different series types such as pie, doughnut, and radial bar series. Each type represents data in a unique style. It is more user friendly and has greater UI visualization.
- Plots data against multiple scales that help to visualize the mixed types of data in a single chart.
- Supports to render multiple series at the same time with options to compare and visualize two different chart series simultaneously.
- Provides various options to customize the chart features, labels, legends, series, etc. and visualize them accordingly.
You can get the examples in the following link:: Flutter Charts.
Was this page helpful?
Yes
No
Thank you for your feedback!
Thank you for your feedback and comments. We will rectify this as soon as possible!
An unknown error has occurred. Please try again.
Help us improve this page