Zooming and Panning in Flutter Charts
Pinch zooming
Pinch zooming can be enabled by enablePinching property and defaults to false. Pinching can be performed by moving two fingers over the chart.
@override
    Widget build(BuildContext context) {
      return Scaffold(
        body: SafeArea(
          child: Center(
            child: Container(
              height: 300,
              width: 350,
              child: SfCartesianChart(
                zoomPanBehavior: ZoomPanBehavior(
                  // Enables pinch zooming
                  enablePinching: true
                )
              )
            )
          )
        )
      );
    }
Double tap zooming
Double tap zooming can be enabled using enableDoubleTapZooming property. Defaults to false.
@override
    Widget build(BuildContext context) {
      return Scaffold(
        body: SafeArea(
          child: Center(
            child: Container(
              height: 300,
              width: 350,
              child: SfCartesianChart(
                zoomPanBehavior: ZoomPanBehavior(
                  // Performs zooming on double tap
                  enableDoubleTapZooming: true
                )
              )
            )
          )
        )
      );
    }
Selection zooming
By specifying enableSelectionZooming property to true, you can long press and drag to select a range on the chart to be zoomed in.
Selection rectangle customization
You can customize the selection rectangle using the below properties.
-
selectionRectBorderWidth– used to change the stroke width of the selection rectangle. -
selectionRectBorderColor– used to change the stroke color of the selection rectangle. -
selectionRectColor- used to change the background color of the selection rectangle.
@override
    Widget build(BuildContext context) {
      return Scaffold(
        body: SafeArea(
          child: Center(
            child: Container(
              height: 300,
              width: 350,
              child: SfCartesianChart(
                zoomPanBehavior: ZoomPanBehavior(
                  enableSelectionZooming: true,
                  selectionRectBorderColor: Colors.red,
                  selectionRectBorderWidth: 1,
                  selectionRectColor: Colors.grey
                )
              )
            )
          )
        )
      );
    }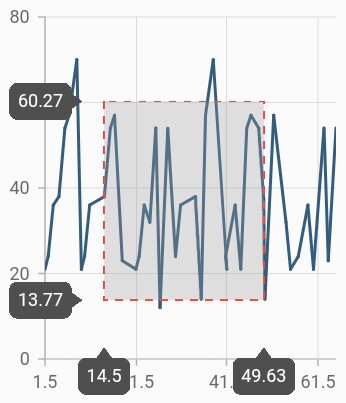
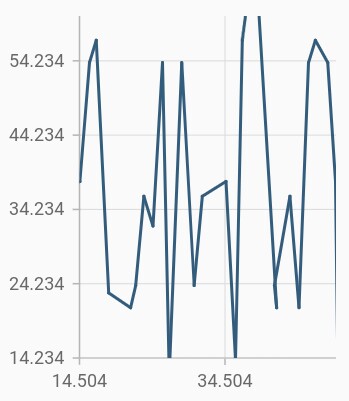
Following screenshot shows the zoomed area
Show axis tooltip
The axis tooltip on selection zooming can be enabled using enable property of crosshairTooltip. You can customize the appearance of axis tooltip using the following properties.
-
enable- used to enable the axis tooltip. -
borderWidth– used to change the stroke width of the axis tooltip. -
borderColor– used to change the stroke color of the axis tooltip. -
format- by default, axis value will be displayed in the tooltip, and it can be customized by adding desired text as prefix or suffix. -
textStyle– used to change the text color, size, font family, fontStyle, and font weight. -
textStyle.color– used to change the color of the text. -
textStyle.fontFamily- used to change the font family for chart title. -
textStyle.fontStyle– used to change the font style for the chart title. -
textStyle.fontSize- used to change the font size for the chart title.
@override
    Widget build(BuildContext context) {
      return Scaffold(
        body: SafeArea(
          child: Center(
            child: Container(
              child: SfCartesianChart(
                primaryXAxis: NumericAxis(
                  crosshairTooltip: InteractiveTooltip(
                  // Displays the axis tooltip
                  enable: true,
                  borderColor: Colors.red,
                  borderWidth: 2
                )
              ),
                primaryYAxis: NumericAxis(
                  crosshairTooltip: InteractiveTooltip(
                  enable: true,
                  borderColor: Colors.red,
                  borderWidth: 2
                )
              ),
                zoomPanBehavior: ZoomPanBehavior(
                  enableDoubleTapZooming: true,
                  enablePinching: true,
                  // Enables the selection zooming
                  enableSelectionZooming: true
                )
              )
            )
          )
        )
      );
    }
Auto interval on zooming
The enableAutoIntervalOnZooming property determines the update of axis internal based on the current visible range while zooming the chart. Default value of this property is true. If this property is false, the nice internal will not be calculated for new range after zoom in and actual interval will be sustained.
@override
    Widget build(BuildContext context) {
      return Scaffold(
        body: SafeArea(
          child: Center(
            child: Container(
              child: SfCartesianChart(
                primaryXAxis: DateTimeAxis(
                  // Intervals will be fixed, not calculated automatically based on the visible range on zooming
                  enableAutoIntervalOnZooming: false
                )
              )
            )
          );
        }
Maximum zoom level
The maximumZoomLevel property defines the maximum zooming level. Zooming will be stopped after reaching this value. This defaults to null.
@override
    Widget build(BuildContext context) {
      return Scaffold(
        body: SafeArea(
          child: Center(
            child: Container(
              child: SfCartesianChart(
                zoomPanBehavior: ZoomPanBehavior(
                  maximumZoomLevel: 3
                )
              )
            )
          )
        )
      );
    }
Also refer zooming, zoom start and zoom end events for customizing the zooming further.