Technical indicators in Flutter Charts
The different types of technical indicators available in chart are follows:
-
Accumulation distribution indicator- AD -
Average true range indicator- ATR Bollinger band indicator-
Exponential moving average indicator- EMA -
Moving average convergence divergence- MACD Momentum indicator-
Relative strength index indicator- RSI -
Simple moving average indicator- SMA Stochastic indicator-
Triangular moving average indicator- TMA
Adding Technical indicator into Chart
To render any indicator, add it to the TechnicalIndicators collection using the indicators in SfCartesianChart.The following properties are used to customize the appearance:
-
isVisible- To check the visibility of the indicator. -
period- Used to indicates the moving average period. -
signalLineColor- Used to defines the color for the respective indicator line. -
signalLineWidth- Used to change the signal line width. -
seriesName- Used to bind the data source of chart series to technical indicators, including x and y axis. -
xAxisName,yAxisName- Used to set the x and y axes -
animationDuration- To control the duration of animation -
dataSource- Directly bind the values such asxValueMapper,lowValueMapper,highValueMapper,openValueMapper,closeValueMapper -
isVisibleInLegend,legendItemText,legendIconType- Used to change the legend visibility,text and Icon type -
name- Used to define the label for corresponding indicators. -
dashArray- Used to render the indicators with dashes.
Note If you giving series and indicator in the chart, you can add the same seriesName to the series and indicator, otherwise you can directly bind the dataSource to the indicators property.
Indicator Types
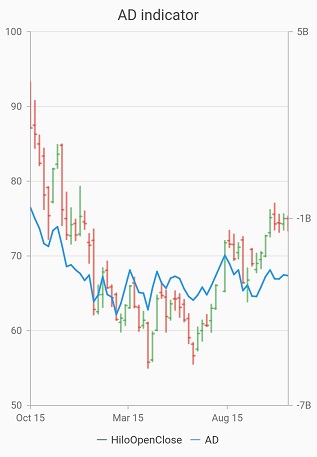
Accumulation distribution indicator (AD)
Accumulation distribution indicator is a volume-based indicator designed to measure the accumulative flow of money into and out of a security. It requires volumeValueMapper property additionally with the data source to calculate the signal line.
Refer the following example,
@override
     Widget build(BuildContext context) {
       return Scaffold(
        body: Center(
          child: SfCartesianChart(
            legend: Legend(isVisible: true,
            indicators: <TechnicalIndicators<Sample,dynamic>>[AccumulationDistributionIndicator<Sample, dynamic>(
                  seriesName: 'HiloOpenClose')],
            series: <ChartSeries<Sample, dynamic>>[
              HiloOpenCloseSeries<Sample, dynamic>(
              dataSource: sample,
              xValueMapper: (Sample sales, _) => sales.x,
              lowValueMapper: (Sample sales, _) => sales.low,
              highValueMapper: (Sample sales, _) => sales.high,
              openValueMapper: (Sample sales, _) => sales.open,
              closeValueMapper: (Sample sales, _) => sales.close,
              name: 'HiloOpenClose'),])));
      }}
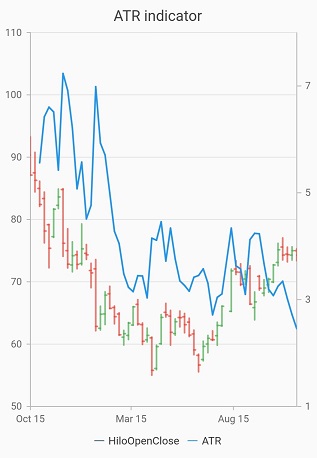
Average true range indicator(ATR)
ATR indicator is a technical analysis volatility indicator. This indicator does not indicate the price trend. simply the degree of price volatility. The average true range is an N-day smoothed moving average (SMMA) of the true range values.
Refer the following example,
@override
    Widget build(BuildContext context) {
     return Scaffold(
        body: Center(
         child: SfCartesianChart(
          legend: Legend(isVisible: true,
          indicators:
          <TechnicalIndicators<dynamic,   dynamic>>[
          AtrIndicator<dynamic, dynamic>(
            period: 3,
            seriesName: 'HiloOpenClose')],
    series: <CartesianSeries<Sample, dynamic>>[
              name: 'HiloOpenClose'),
              ])));
        }
      }
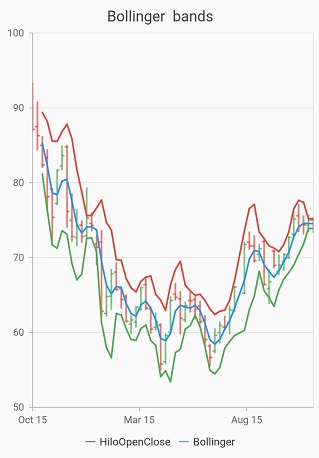
Bollinger band Indicator
This indicator also having upperLineColor, lowerLineColor property for defining the brushes for the indicator lines.
Also, we can specify standard deviation values for BollingerBand indicator using standardDeviation property.
Refer the following example,
@override
    Widget build(BuildContext context) {
     return Scaffold(
       body: Center(
         child: SfCartesianChart(
           legend: Legend(isVisible: true,
           indicators:        <TechnicalIndicators<dynamic, dynamic>[ BollingerBandIndicator<dynamic, dynamic>(
                  period: 3,
                  seriesName: 'HiloOpenClose')],
           series: <CartesianSeries<Sample,dynamic>>[
              HiloOpenCloseSeries<Sample, dynamic>(name: 'HiloOpenClose')
              ])));
       }
     }
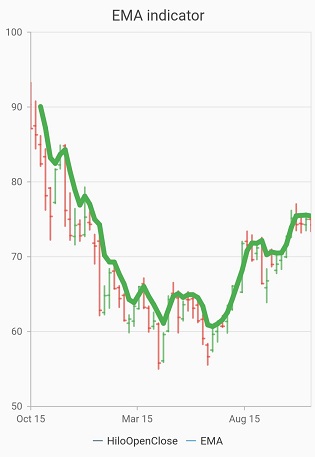
Exponential moving average indicator (EMA)
An EMA indicator is a simple, arithmetic moving average that is calculated by adding the closing price for the number of time periods and dividing the total value by the number of periods.
It also has a valueField property. Based on this property Indicator will render.
Refer the following example,
@override
    Widget build(BuildContext context) {
      return Scaffold(
        body: Center(
          child: SfCartesianChart(
            legend: Legend(isVisible: true,
            indicators: <TechnicalIndicators<dynamic, dynamic>>[
        EmaIndicator<dynamic, dynamic>(
            seriesName: 'HiloOpenClose',
            valueField: 'high',)],
            series: <ChartSeries<Sample, dynamic>>[
        HiloOpenCloseSeries<Sample, dynamic>(
            name: 'HiloOpenClose')
            ])));
     }
    }
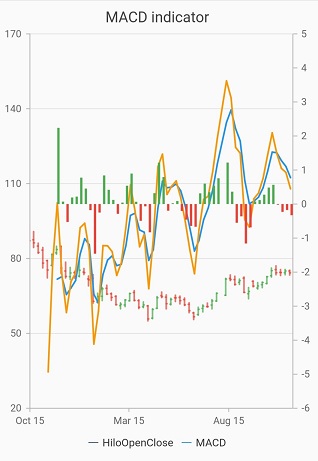
Moving average convergence divergence (MACD)
This is mostly using indicator having shortPeriod and longPeriod for defining the motion of the indicator.
Also you can draw Line, Histogram MACD or Both using the macdType property,
The macdLineColor property is used to define the color for the MACD line and the histogramNegativeColor and histogramPositiveColor property is used to define the color for the MACD histogram.
Refer the following example,
@override
    Widget build(BuildContext context) {
     return Scaffold(
       body: Center(
          child: SfCartesianChart(
            legend: Legend(isVisible: true,
            indicators: <TechnicalIndicators<dynamic, dynamic>>[
          MacdIndicator<dynamic, dynamic>(
              longPeriod: 5,
              shortPeriod: 2,
              seriesName: 'HiloOpenClose')],
            series: <CartesianSeries<Sample, dynamic>>[
          HiloOpenCloseSeries<Sample, dynamic>(name: 'HiloOpenClose')
          ])));
       }
     }
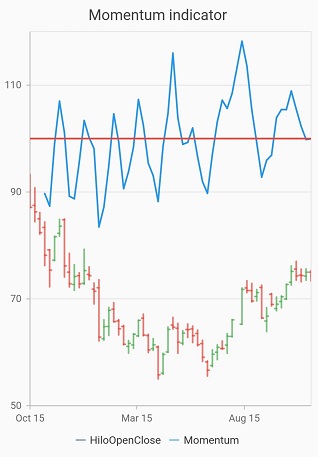
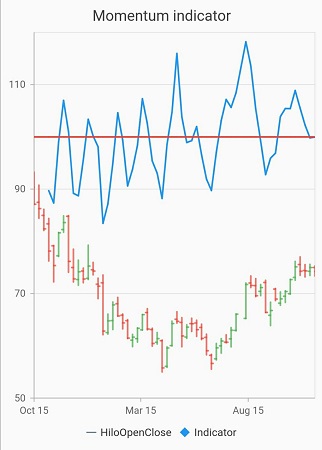
Momentum Indicator
This indicator also having a centerline. The centerLineColor and centerLineWidth property is used to define center line.
Refer the following example,
@override
    Widget build(BuildContext context) {
      return Scaffold(
        body: Center(
          child: SfCartesianChart(
            legend: Legend(isVisible: true,
            indicators: <TechnicalIndicators<dynamic, dynamic>>[
          MomentumIndicator<dynamic, dynamic>(
            period: 3,
            seriesName: 'HiloOpenClose',)],
           series: <ChartSeries<Sample, dynamic>>[
          HiloOpenCloseSeries<Sample, dynamic>(name: 'HiloOpenClose')
          ])));
     }
    }
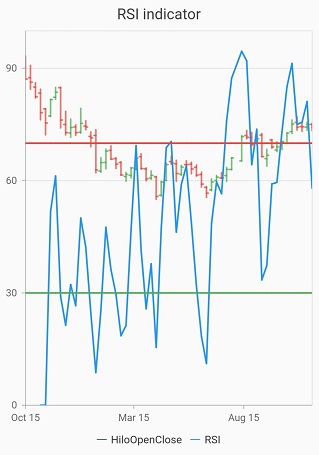
Relative strength index Indicator(RSI)
The RSI indicator has an additional two lines other than the signal line.They indicate the overBought andoverSold region.
The upperLineColor property is used to define the color for the line that indicates overBought region, and the lowerLineColor property is used to define the color for the line that indicates overSold region.
Refer the following example,
@override
    Widget build(BuildContext context) {
      return Scaffold(
        body: Center(
          child: SfCartesianChart(
            legend: Legend(isVisible: true,
             indicators: <TechnicalIndicators<dynamic, dynamic>>[
          RsiIndicator<dynamic, dynamic>(
            period: 3,
            seriesName: 'HiloOpenClose',
            overbought: 70,
            oversold: 30)],
            series: <ChartSeries<Sample, dynamic>>[
          HiloOpenCloseSeries<Sample, dynamic>(name: 'HiloOpenClose')])));
     }
    }
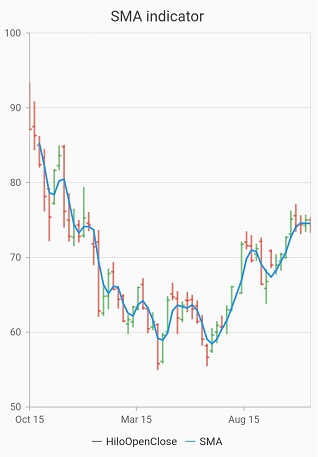
Simple moving average indicator(SMA)
The Simple moving average indicator is similar to Exponential moving average indicator and this can be defined using the following code examples.
@override
    Widget build(BuildContext context) {
      return Scaffold(
        body: Center(
          child: SfCartesianChart(
            legend: Legend(isVisible: true,
            indicators: <TechnicalIndicators<dynamic, dynamic>>[
          SmaIndicator<dynamic, dynamic>(
            seriesName: 'HiloOpenClose',
            valueField: 'close')],
           series: <ChartSeries<Sample, dynamic>>[
          HiloOpenCloseSeries<Sample, dynamic>(name: 'HiloOpenClose')])));
    }}
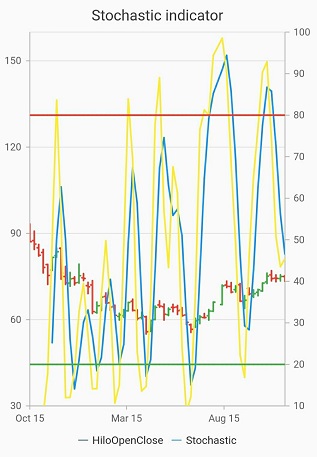
Stochastic indicator
This indicator is used to measure the range and momentum of price movements. It contains kPeriod and dPeriod property defining the ‘k’ percentage and ‘d’ percentage respectively.
In this indicator upperLineColor,lowerLineColor and periodLineColor property are used to define the color for the Stochastic indicator lines.
Refer the following example,
@override
    Widget build(BuildContext context) {
      return Scaffold(
        body: Center(
          child: SfCartesianChart(
            legend: Legend(isVisible: true,
            indicators: <TechnicalIndicators<dynamic, dynamic>>[
          StochasticIndicator<dynamic, dynamic>(
              seriesName: 'HiloOpenClose',,
              kPeriod: 2,
              dPeriod: 3)],
             series: <ChartSeries<Sample, dynamic>>[
          HiloOpenCloseSeries<Sample, dynamic>(name: 'HiloOpenClose')])));
    }}
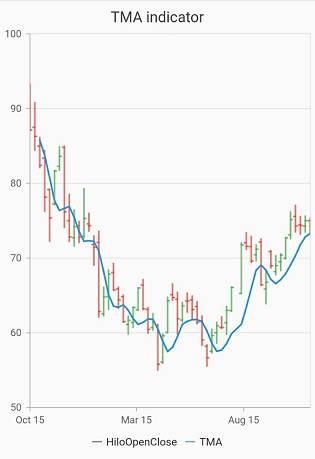
Triangular moving average indicator (TMA)
A TMA indicator is simply a double-smoothed simple moving average of data calculated over a period where the middle portion of the data has more weight.
Refer the following example,
@override
    Widget build(BuildContext context) {
      return Scaffold(
        body: Center(
          child: SfCartesianChart(
            legend: Legend(isVisible: true,
            indicators: <TechnicalIndicators<dynamic, dynamic>>[
          TmaIndicator<Sample, dynamic>(
              seriesName: 'HiloOpenClose',
              valueField: 'low')],
            series: <ChartSeries<Sample, dynamic>>[
          HiloOpenCloseSeries<Sample, dynamic>(name: 'HiloOpenClose')])));
    }}
Legend for technical indicators
Legend provides information about the series rendered in the chart. Legend for the indicator is rendered along with the series legend when the legend is set to be visible. Also when the name property is given to an indicator, the legend name is changed based on the indicator name.legendItemText can also be provided for changing the name of the legend. In default rendering the legendIconType will be a horizontal line.
The following code example can define the legend.
@override
    Widget build(BuildContext context){
      return Scaffold(
        body: Center(
          child: SfCartesianChart(
            indicators: <TechnicalIndicators<dynamic, dynamic>>[
              MomentumIndicator<dynamic, dynamic>(
                  seriesName: 'HiloOpenClose',
                  legendIconType: LegendIconType.diamond,
                  legendItemText: 'Indicator')],
            series: <ChartSeries<Sample, dynamic>>[
              HiloOpenCloseSeries<Sample, dynamic>(
                  name: 'HiloOpenClose')])));
    }}
Also refer technical indicators event for customizing the tooltip further.
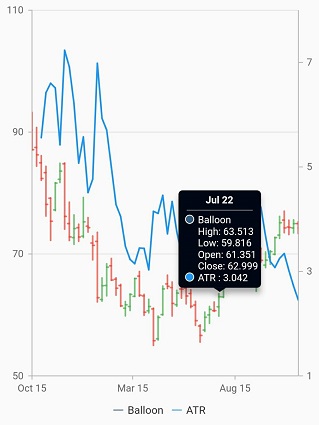
Tooltip for technical indicators
The chart will display the segment information through the tooltip. It is used to show information about the segment when you tap on the segment. The technical indicator tooltip has the same ActivationMode that has been given in the TooltipBehavior of the series.
@override
    Widget build(BuildContext context){
      return Scaffold(
        body: Center(
          child: SfCartesianChart(
            tooltipBehavior: TooltipBehavior(enable: true, shared: true),
            indicators: <TechnicalIndicators<dynamic, dynamic>>[
              ATRIndicator<dynamic, dynamic>(
                  seriesName: 'HiloOpenClose',
                  )],
            series: <ChartSeries<Sample, dynamic>>[
              HiloOpenCloseSeries<Sample, dynamic>(
                  enableTooltip: true,
                  name: 'HiloOpenClose')])));
    }}