Cartesian series customization
Animation
SfCartesianChart provides animation support for the series. Series will be animated while rendering. Animation is enabled by default, you can also control the duration of the animation using animationDuration property. You can disable the animation by setting 0 value to that property.
@override
    Widget build(BuildContext context) {
        return Scaffold(
            body: Center(
                child: Container(
                    child: SfCartesianChart(
                        primaryXAxis: CategoryAxis(),
                        series: <CartesianSeries>[
                            ColumnSeries<ChartData, String>(
                                dataSource: chartData,
                                xValueMapper: (ChartData data, _) => data.x,
                                yValueMapper: (ChartData data, _) => data.y,
                                // Duration of series animation
                                animationDuration: 1000
                            )
                        ]
                    )
                )
            )
        );
    }
Dynamic animation
SfCartesianChart also provide the dynamic animation support for the series.The series can be dynamically added to the charts, it will animated by setting the timer value. when you set the animationDuration value to 0, the series won’t be animated.
Transpose the series
The isTransposed property of CartesianSeries is used to transpose the horizontal and vertical axes, to view the data in a different perspective. Using this feature, you can render vertical charts.
@override
    Widget build(BuildContext context) {
        return Scaffold(
            body: Center(
                child: Container(
                    child: SfCartesianChart(
                        // Transpose the chart
                        isTransposed: true,
                        primaryXAxis: CategoryAxis(),
                        series: <CartesianSeries>[
                            SplineSeries<ChartData, String>(
                                dataSource: chartData,
                                xValueMapper: (ChartData data, _) => data.x,
                                yValueMapper: (ChartData data, _) => data.y,
                            )
                        ]
                    )
                )
            )
        );
    }
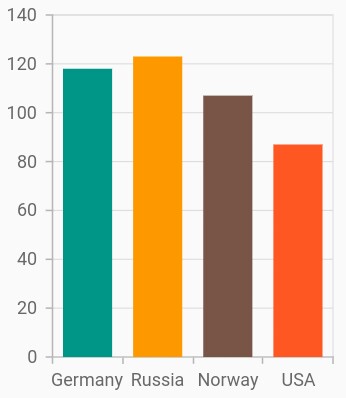
Color palette
The palette property is used to define the colors for the series available in chart. By default, a set of 10 colors are predefined for applying it to the series. If the colors specified in the series are less than the number of series, than the remaining series are filled with the specified palette colors rotationally.
@override
    Widget build(BuildContext context) {
        return Scaffold(
            body: Center(
                child: Container(
                    child: SfCartesianChart(
                        primaryXAxis: CategoryAxis(),
                        // Palette colors
                        palette: <Color>[
                            Colors.teal,
                            Colors.orange,
                            Colors.brown
                        ],
                        series: <CartesianSeries>[
                            ColumnSeries<ChartData, String>(
                                dataSource: chartData,
                                xValueMapper: (ChartData data, _) => data.x,
                                yValueMapper: (ChartData data, _) => data.y
                            ),
                            ColumnSeries<ChartData, String>(
                                dataSource: chartData,
                                xValueMapper: (ChartData data, _) => data.x,
                                yValueMapper: (ChartData data, _) => data.y2
                            ),
                            ColumnSeries<ChartData, String>(
                                dataSource: chartData,
                                xValueMapper: (ChartData data, _) => data.x,
                                yValueMapper: (ChartData data, _) => data.y3
                            )
                        ]
                    )
                )
            )
        );
    }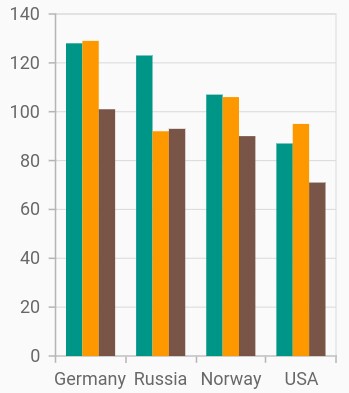
Color mapping for data points
The pointColorMapper property is used to map the color field from the data source.
@override
    Widget build(BuildContext context) {
        final List<ChartData> chartData = [
            ChartData('Germany', 118, Colors.teal),
            ChartData('Russia', 123, Colors.orange),
            ChartData('Norway', 107, Colors.brown),
            ChartData('USA', 87, Colors.deepOrange)
        ];
        return Scaffold(
            body: Center(
                child: Container(
                    child: SfCartesianChart(
                        primaryXAxis: CategoryAxis(),
                        series: <CartesianSeries>[
                            ColumnSeries<ChartData, String>(
                                dataSource: chartData,
                                xValueMapper: (ChartData data, _) => data.x,
                                yValueMapper: (ChartData data, _) => data.y,
                                // Map color for each data points from the data source
                                pointColorMapper: (ChartData data, _) => data.color
                            )
                        ]
                    )
                )
            )
        );
    }

    class ChartData {
        ChartData(this.x, this.y, this.color);
            final String x;
            final double y;
            final Color color;
    }
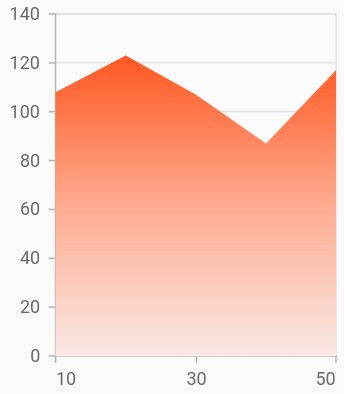
Gradient fill
The gradient property is used to define the gradient colors. The colors from this property is used for series.
@override
    Widget build(BuildContext context) {
        final List<Color> color = <Color>[];
        color.add(Colors.deepOrange[50]);
        color.add(Colors.deepOrange[200]);
        color.add(Colors.deepOrange);

        final List<double> stops = <double>[];
        stops.add(0.0);
        stops.add(0.5);
        stops.add(1.0);

        final LinearGradient gradientColors =
            LinearGradient(colors: color, stops: stops);

        return Scaffold(
            body: Center(
                child: Container(
                    child: SfCartesianChart(
                        series: <CartesianSeries>[
                            AreaSeries<ChartData, double>(
                                dataSource: chartData,
                                xValueMapper: (ChartData data, _) => data.x,
                                yValueMapper: (ChartData data, _) => data.y,
                                // Applies gradient color
                                gradient: gradientColors
                            )
                        ]
                    )
                )
            )
        );
    }
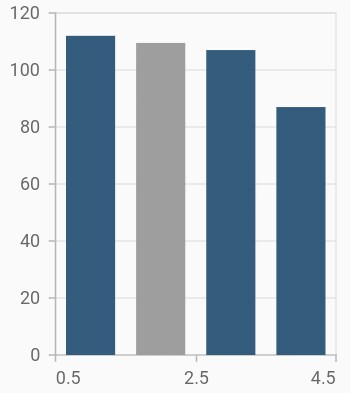
Empty points
The data points that has null value are considered as empty points. Empty data points are ignored and not plotted in the chart. By using emptyPointSettings property in series, you can decide the action taken for empty points. Available modes are gap, zero, drop and average. Default mode of the empty point is gap.
@override
    Widget build(BuildContext context) {

        final List<ChartData> chartData = [
            ChartData(1, 112),
            ChartData(2, null),
            ChartData(3, 107),
            ChartData(4, 87)
        ];

        return Scaffold(
            body: Center(
                child: Container(
                    child: SfCartesianChart(
                        series: <CartesianSeries>[
                            ColumnSeries<ChartData, double>(
                                dataSource: chartData,
                                xValueMapper: (ChartData data, _) => data.x,
                                yValueMapper: (ChartData data, _) => data.y,
                                emptyPointSettings: EmptyPointSettings(
                                    // Mode of empty point
                                    mode: EmptyPointMode.average
                                )
                            )
                        ]
                    )
                )
            )
        );
    }
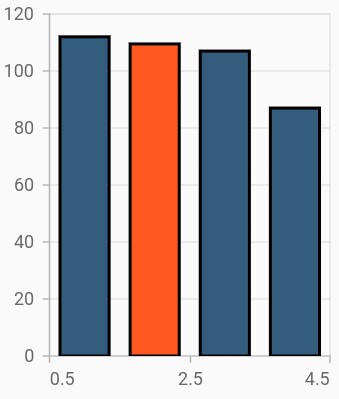
Empty point customization
Specific color for empty point can be set by color property in emptyPointSettings. The borderWidth property is used to change the stroke width of the empty point and borderColor is used to change the stroke color of the empty point.
@override
    Widget build(BuildContext context) {

        final List<ChartData> chartData = [
            ChartData(1, 112),
            ChartData(2, null),
            ChartData(3, 107),
            ChartData(4, 87)
        ];

        return Scaffold(
            body: Center(
                child: Container(
                    child: SfCartesianChart(
                        series: <CartesianSeries>[
                            ColumnSeries<ChartData, double>(
                                dataSource: chartData,
                                xValueMapper: (ChartData data, _) => data.x,
                                yValueMapper: (ChartData data, _) => data.y,
                                borderColor: Colors.blue,
                                borderWidth: 5,
                                emptyPointSettings: EmptyPointSettings(
                                    mode: EmptyPointMode.average,
                                    color: Colors.red,
                                    borderColor: Colors.black,
                                    borderWidth: 2
                                )
                            )
                        ]
                    )
                )
            )
        );
    }
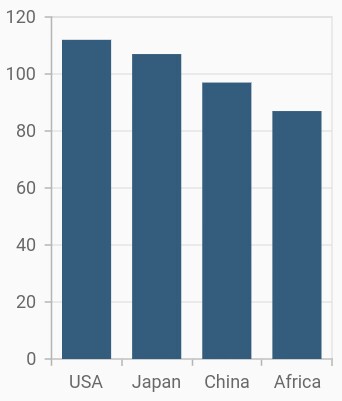
Sorting
The chart’s data source can be sorted using the sortingOrder and sortFieldValueMapper properties of series. The sortingOrder property specifies the data points in the series can be sorted in ascending or descending order. The data points will be rendered in the specified order if sortingOrder is set to none. The sortFieldValueMapper specifies the field in the data source, which is considered for sorting the data points.
@override
    Widget build(BuildContext context) {

         final List<ChartData> chartData = [
            ChartData('USA', 112),
            ChartData('China', 97),
            ChartData('Japan', 107),
            ChartData('Africa', 87),
        ];

        return Scaffold(
            body: Center(
                child: Container(
                    child: SfCartesianChart(
                        primaryXAxis: CategoryAxis(),
                        series: <CartesianSeries>[
                            ColumnSeries<ChartData, String>(
                                dataSource: chartData,
                                xValueMapper: (ChartData data, _) => data.x,
                                yValueMapper: (ChartData data, _) => data.y,
                                sortingOrder: SortingOrder.descending,
                                // Sorting based on the specified field
                                sortFieldValueMapper: (ChartData data, _) => data.x
                            )
                        ]
                    )
                )
            )
        );
    }