Polylines in Flutter Maps (SfMaps)
28 Jul 202524 minutes to read
Polyline layer is a sublayer that renders a group of MapPolyline on MapShapeLayer and MapTileLayer. This section helps you learn how to add polylines and customize them.
Adding polylines
The polylines is a collection of MapPolyline. Every single MapPolyline connects multiple coordinates through the points property.
NOTE
It is applicable for both the tile layer and shape layer.
In the shape layer
late List<MapLatLng> polyline;
late List<List<MapLatLng>> polylines;
late MapShapeSource dataSource;
late MapZoomPanBehavior zoomPanBehavior;

@override
void initState() {
  polyline = <MapLatLng>[
    MapLatLng(13.0827, 80.2707),
    MapLatLng(13.1746, 79.6117),
    MapLatLng(13.6373, 79.5037),
    MapLatLng(14.4673, 78.8242),
    MapLatLng(14.9091, 78.0092),
    MapLatLng(16.2160, 77.3566),
    MapLatLng(17.1557, 76.8697),
    MapLatLng(18.0975, 75.4249),
    MapLatLng(18.5204, 73.8567),
    MapLatLng(19.0760, 72.8777),
  ];

  polylines = <List<MapLatLng>>[polyline];
  dataSource = MapShapeSource.asset(
    'assets/india.json',
     shapeDataField: 'name',
  );

  zoomPanBehavior = MapZoomPanBehavior(
     zoomLevel: 2,
     focalLatLng: MapLatLng(20.3173, 78.7139),
  );
  super.initState();
}

@override
Widget build(BuildContext context) {
  return Scaffold(
    body: SfMaps(
      layers: [
        MapShapeLayer(
          source: dataSource,
          sublayers: [
            MapPolylineLayer(
              polylines: List<MapPolyline>.generate(
                polylines.length,
                (int index) {
                  return MapPolyline(
                    points: polylines[index],
                  );
                },
              ).toSet(),
            ),
          ],
          zoomPanBehavior: zoomPanBehavior,
        ),
      ],
    ),
  );
}

class PolylineModel {
  PolylineModel(this.points);
  final List<MapLatLng> points;
}
In the tile layer
late List<MapLatLng> polyline;
late List<List<MapLatLng>> polylines;
late MapZoomPanBehavior zoomPanBehavior;

@override
void initState() {
  polyline = <MapLatLng>[
    MapLatLng(13.0827, 80.2707),
    MapLatLng(13.1746, 79.6117),
    MapLatLng(13.6373, 79.5037),
    MapLatLng(14.4673, 78.8242),
    MapLatLng(14.9091, 78.0092),
    MapLatLng(16.2160, 77.3566),
    MapLatLng(17.1557, 76.8697),
    MapLatLng(18.0975, 75.4249),
    MapLatLng(18.5204, 73.8567),
    MapLatLng(19.0760, 72.8777),
  ];

  polylines = <List<MapLatLng>>[polyline];
  zoomPanBehavior = MapZoomPanBehavior(
    zoomLevel: 5,
    focalLatLng: MapLatLng(20.3173, 78.7139),
  );
  super.initState();
}

@override
Widget build(BuildContext context) {
  return Scaffold(
    body: SfMaps(
      layers: [
        MapTileLayer(
          urlTemplate: 'https://tile.openstreetmap.org/{z}/{x}/{y}.png',
          sublayers: [
            MapPolylineLayer(
              polylines: List<MapPolyline>.generate(
                polylines.length,
                (int index) {
                  return MapPolyline(
                    points: polylines[index],
                  );
                },
              ).toSet(),
            ),
          ],
          zoomPanBehavior: zoomPanBehavior,
        ),
      ],
    ),
  );
}

class PolylineModel {
  PolylineModel(this.points);
  final List<MapLatLng> points;
}
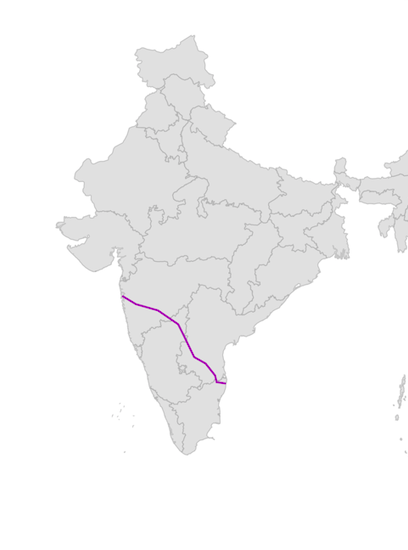
Color
You can apply the same color for all MapPolyline in the polylines collection using the MapPolylineLayer.color property. Alternatively, you can apply different colors to each MapPolyline in the polylines collection using the individual MapPolyline.color property.
late List<MapLatLng> polyline;
late List<PolylineModel> polylines;
late MapShapeSource dataSource;
late MapZoomPanBehavior zoomPanBehavior;

@override
void initState() {
  polyline = <MapLatLng>[
    MapLatLng(13.0827, 80.2707),
    MapLatLng(13.1746, 79.6117),
    MapLatLng(13.6373, 79.5037),
    MapLatLng(14.4673, 78.8242),
    MapLatLng(14.9091, 78.0092),
    MapLatLng(16.2160, 77.3566),
    MapLatLng(17.1557, 76.8697),
    MapLatLng(18.0975, 75.4249),
    MapLatLng(18.5204, 73.8567),
    MapLatLng(19.0760, 72.8777),
  ];

  polylines = <PolylineModel>[
    PolylineModel(polyline, Colors.purple),
  ];
  dataSource = MapShapeSource.asset(
    'assets/india.json',
    shapeDataField: 'name',
  );

  zoomPanBehavior = MapZoomPanBehavior(
    zoomLevel: 1,
    focalLatLng: MapLatLng(20.3173, 78.7139),
  );
  super.initState();
}

@override
Widget build(BuildContext context) {
  return Scaffold(
    body: SfMaps(
      layers: [
        MapShapeLayer(
          source: dataSource,
          sublayers: [
            MapPolylineLayer(
              polylines: List<MapPolyline>.generate(
                polylines.length,
                (int index) {
                  return MapPolyline(
                    points: polylines[index].points,
                    color: polylines[index].color,
                  );
                },
              ).toSet(),
            ),
          ],
          zoomPanBehavior: zoomPanBehavior,
        ),
      ],
    ),
  );
}

class PolylineModel {
  PolylineModel(this.points, this.color);
  final List<MapLatLng> points;
  final Color color;
}
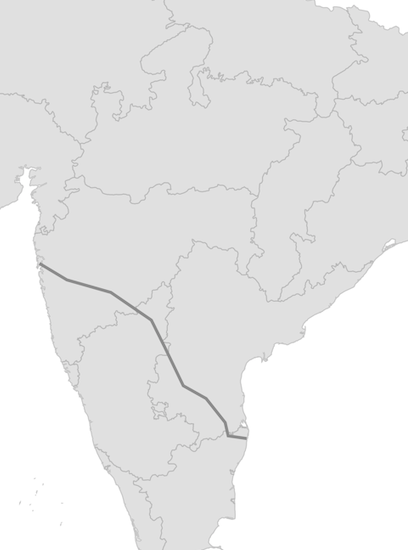
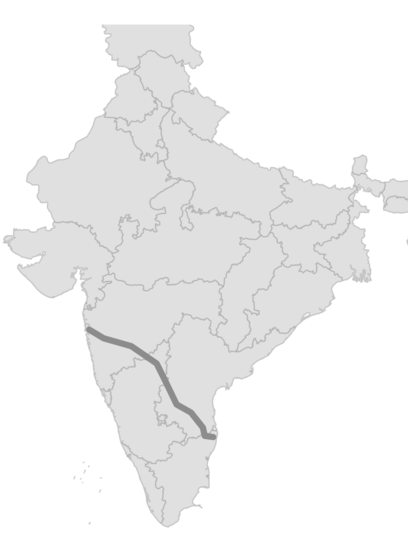
Width
You can apply the same width for all MapPolyline in the polylines collection using the MapPolylineLayer.width property. Alternatively, you can apply different width to each MapPolyline in the polylines collection using the individual MapPolyline.width property. The default value of the MapPolylineLayer.width property is 2.
late List<MapLatLng> polyline;
late List<PolylineModel> polylines;
late MapShapeSource dataSource;
late MapZoomPanBehavior zoomPanBehavior;

@override
void initState() {
  polyline = <MapLatLng>[
    MapLatLng(13.0827, 80.2707),
    MapLatLng(13.1746, 79.6117),
    MapLatLng(13.6373, 79.5037),
    MapLatLng(14.4673, 78.8242),
    MapLatLng(14.9091, 78.0092),
    MapLatLng(16.2160, 77.3566),
    MapLatLng(17.1557, 76.8697),
    MapLatLng(18.0975, 75.4249),
    MapLatLng(18.5204, 73.8567),
    MapLatLng(19.0760, 72.8777),
  ];

  polylines = <PolylineModel>[
    PolylineModel(polyline, 3),
  ];
  dataSource = MapShapeSource.asset(
    'assets/india.json',
    shapeDataField: 'name',
  );

  zoomPanBehavior = MapZoomPanBehavior(
    zoomLevel: 2,
    focalLatLng: MapLatLng(20.3173, 78.7139),
  );
  super.initState();
}

@override
Widget build(BuildContext context) {
  return Scaffold(
    body: SfMaps(
      layers: [
        MapShapeLayer(
          source: dataSource,
          sublayers: [
            MapPolylineLayer(
              polylines: List<MapPolyline>.generate(
                polylines.length,
                (int index) {
                  return MapPolyline(
                    points: polylines[index].points,
                    width: polylines[index].width,
                  );
                },
              ).toSet(),
            ),
          ],
          zoomPanBehavior: zoomPanBehavior,
        ),
      ],
    ),
  );
}

class PolylineModel {
  PolylineModel(this.points, this.width);
  final List<MapLatLng> points;
  final double width;
}
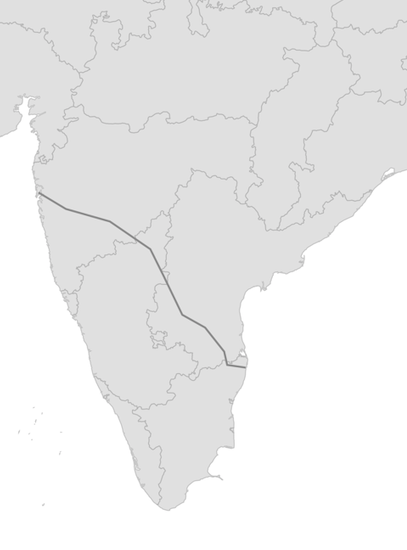
Stroke cap
You can apply the same stroke cap for all MapPolyline in the polylines collection using the MapPolylineLayer.strokeCap property. Alternatively, you can apply different stroke cap to each MapPolyline in the polylines collection using the individual MapPolyline.strokeCap property. The default value of the MapPolylineLayer.strokeCap property is StrokeCap.butt. The available values are butt, round, and square.
late List<MapLatLng> polyline;
late List<PolylineModel> polylines;
late MapShapeSource dataSource;
late MapZoomPanBehavior zoomPanBehavior;

@override
void initState() {
  polyline = <MapLatLng>[
    MapLatLng(13.0827, 80.2707),
    MapLatLng(13.1746, 79.6117),
    MapLatLng(13.6373, 79.5037),
    MapLatLng(14.4673, 78.8242),
    MapLatLng(14.9091, 78.0092),
    MapLatLng(16.2160, 77.3566),
    MapLatLng(17.1557, 76.8697),
    MapLatLng(18.0975, 75.4249),
    MapLatLng(18.5204, 73.8567),
    MapLatLng(19.0760, 72.8777),
  ];

  polylines = <PolylineModel>[
    PolylineModel(polyline, 5),
  ];
  dataSource = MapShapeSource.asset(
    'assets/india.json',
    shapeDataField: 'name',
  );

  zoomPanBehavior = MapZoomPanBehavior(
    focalLatLng: MapLatLng(20.3173, 78.7139),
  );
  super.initState();
}

@override
Widget build(BuildContext context) {
  return Scaffold(
    body: SfMaps(
      layers: [
        MapShapeLayer(
          source: dataSource,
          sublayers: [
            MapPolylineLayer(
              polylines: List<MapPolyline>.generate(
                polylines.length,
                    (int index) {
                  return MapPolyline(
                    points: polylines[index].points,
                    width: polylines[index].width,
                    strokeCap: StrokeCap.round,
                  );
                },
              ).toSet(),
            ),
          ],
          zoomPanBehavior: zoomPanBehavior,
        ),
      ],
    ),
  );
}

class PolylineModel {
  PolylineModel(this.points, this.width);

  final List<MapLatLng> points;
  final double width;
}
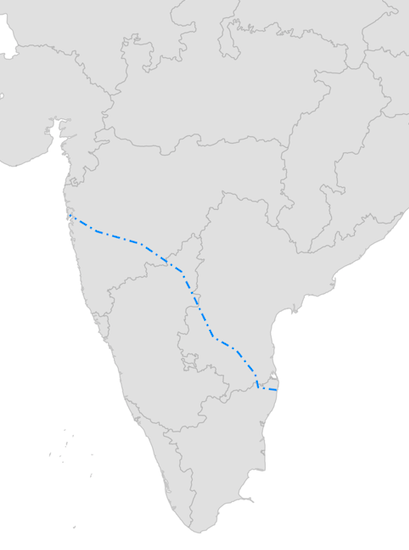
Dash array
You can apply dash support for the polyline using the MapPolyline.dashArray property.
A sequence of dash and gap will be rendered based on the values in this list. Once all values of the list is rendered, it will be repeated again till the end of the polyline.
late List<MapLatLng> polyline;
late List<PolylineModel> polylines;
late MapShapeSource dataSource;
late MapZoomPanBehavior zoomPanBehavior;

@override
void initState() {
  polyline = <MapLatLng>[
    MapLatLng(13.0827, 80.2707),
    MapLatLng(13.1746, 79.6117),
    MapLatLng(13.6373, 79.5037),
    MapLatLng(14.4673, 78.8242),
    MapLatLng(14.9091, 78.0092),
    MapLatLng(16.2160, 77.3566),
    MapLatLng(17.1557, 76.8697),
    MapLatLng(18.0975, 75.4249),
    MapLatLng(18.5204, 73.8567),
    MapLatLng(19.0760, 72.8777),
  ];

  polylines = <PolylineModel>[
    PolylineModel(polyline),
  ];
  dataSource = MapShapeSource.asset(
    'assets/india.json',
    shapeDataField: 'name',
  );

  zoomPanBehavior = MapZoomPanBehavior(
    zoomLevel: 2,
    focalLatLng: MapLatLng(18.3173, 77.7139),
  );
  super.initState();
}

@override
Widget build(BuildContext context) {
  return Scaffold(
    body: SfMaps(
      layers: [
        MapShapeLayer(
          source: dataSource,
          sublayers: [
            MapPolylineLayer(
              polylines: List<MapPolyline>.generate(
                polylines.length,
                (int index) {
                  return MapPolyline(
                    points: polylines[index].points,
                    dashArray: [8, 4, 2, 4],
                  );
                },
              ).toSet(),
              color: Colors.blue,
            ),
          ],
          zoomPanBehavior: zoomPanBehavior,
        ),
      ],
    ),
  );
}

class PolylineModel {
  PolylineModel(this.points);
  final List<MapLatLng> points;
}
Animation
You can apply animation for the MapPolyline using the MapPolylineLayer.animation property and customize the animation flow, curve and duration.
By default, there will not be any animation.
late List<MapLatLng> polyline;
late List<PolylineModel> polylines;
late MapShapeSource dataSource;
late MapZoomPanBehavior zoomPanBehavior;
late AnimationController animationController;
late Animation animation;

@override
void initState() {
  polyline = <MapLatLng>[
    MapLatLng(13.0827, 80.2707),
    MapLatLng(13.1746, 79.6117),
    MapLatLng(13.6373, 79.5037),
    MapLatLng(14.4673, 78.8242),
    MapLatLng(14.9091, 78.0092),
    MapLatLng(16.2160, 77.3566),
    MapLatLng(17.1557, 76.8697),
    MapLatLng(18.0975, 75.4249),
    MapLatLng(18.5204, 73.8567),
    MapLatLng(19.0760, 72.8777),
  ];

  polylines = <PolylineModel>[
    PolylineModel(polyline),
  ];
  dataSource = MapShapeSource.asset(
    'assets/india.json',
    shapeDataField: 'name',
  );

  zoomPanBehavior = MapZoomPanBehavior(
     zoomLevel: 2,
     focalLatLng: MapLatLng(19.3173, 76.7139),
  );

  animationController = AnimationController(
     duration: Duration(seconds: 3),
      vsync: this,
  );
  animation = CurvedAnimation(
     parent: animationController,
     curve: Curves.easeInOut,
  );
  animationController.forward(from: 0);
  super.initState();
}

@override
void dispose() {
  animationController.dispose();
  super.dispose();
}

@override
Widget build(BuildContext context) {
  return Scaffold(
    body: SfMaps(
      layers: [
        MapShapeLayer(
          source: dataSource,
          sublayers: [
            MapPolylineLayer(
              polylines: List<MapPolyline>.generate(
                polylines.length,
                (int index) {
                  return MapPolyline(
                    points: polylines[index].points,
                  );
                },
              ).toSet(),
              color: Colors.blue,
              animation: animation,
            ),
          ],
          zoomPanBehavior: zoomPanBehavior,
        ),
      ],
    ),
  );
}

class PolylineModel {
  PolylineModel(this.points);
  final List<MapLatLng> points;
}
Tap
You can use the onTap callback to get a notification if the particular MapPolyline is tapped. You can also customize the tapped MapPolyline based on the index passed in the callback as shown in the below code snippet.
late List<MapLatLng> polyline;
late List<PolylineModel> polylines;
late MapShapeSource dataSource;
late MapZoomPanBehavior zoomPanBehavior;
late int selectedIndex;

@override
void initState() {
  polyline = <MapLatLng>[
    MapLatLng(13.0827, 80.2707),
    MapLatLng(13.1746, 79.6117),
    MapLatLng(13.6373, 79.5037),
    MapLatLng(14.4673, 78.8242),
    MapLatLng(14.9091, 78.0092),
    MapLatLng(16.2160, 77.3566),
    MapLatLng(17.1557, 76.8697),
    MapLatLng(18.0975, 75.4249),
    MapLatLng(18.5204, 73.8567),
    MapLatLng(19.0760, 72.8777),
  ];

  polylines = <PolylineModel>[
    PolylineModel(polyline),
  ];
  dataSource = MapShapeSource.asset(
    'assets/india.json',
    shapeDataField: 'name',
  );

  zoomPanBehavior = MapZoomPanBehavior(
    zoomLevel: 2,
    focalLatLng: MapLatLng(19.3173, 76.7139),
  );

  selectedIndex = -1;
  super.initState();
}

@override
Widget build(BuildContext context) {
  return Scaffold(
    body: SfMaps(
      layers: [
        MapShapeLayer(
          source: dataSource,
          sublayers: [
            MapPolylineLayer(
              polylines: List<MapPolyline>.generate(
                polylines.length,
                (int index) {
                  return MapPolyline(
                    points: polylines[index].points,
                    color: selectedIndex == index ? Colors.pink: Colors.blue,
                    onTap: () {
                      setState(() {
                        selectedIndex = index;
                      });
                    }
                  );
                },
              ).toSet(),
            ),
          ],
          zoomPanBehavior: zoomPanBehavior,
        ),
      ],
    ),
  );
}

class PolylineModel {
  PolylineModel(this.points);
  final List<MapLatLng> points;
}
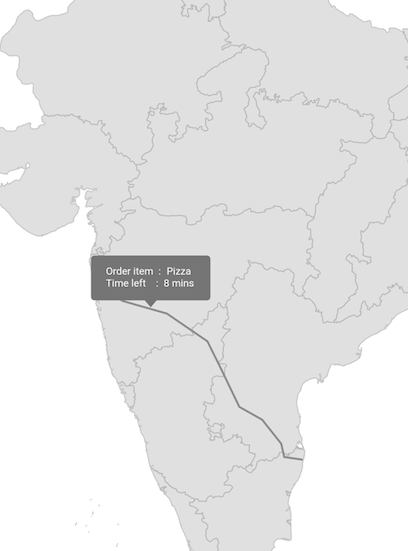
Tooltip
You can show additional information about the polyline drawn using the tooltipBuilder property.
late List<MapLatLng> polyline;
late List<PolylineModel> polylines;
late MapShapeSource dataSource;
late MapZoomPanBehavior zoomPanBehavior;
late Random random;

@override
void initState() {
  polyline = <MapLatLng>[
    MapLatLng(13.0827, 80.2707),
    MapLatLng(13.1746, 79.6117),
    MapLatLng(13.6373, 79.5037),
    MapLatLng(14.4673, 78.8242),
    MapLatLng(14.9091, 78.0092),
    MapLatLng(16.2160, 77.3566),
    MapLatLng(17.1557, 76.8697),
    MapLatLng(18.0975, 75.4249),
    MapLatLng(18.5204, 73.8567),
    MapLatLng(19.0760, 72.8777),
  ];

  polylines = <PolylineModel>[
    PolylineModel(polyline),
  ];
  dataSource = MapShapeSource.asset(
    'assets/india.json',
    shapeDataField: 'name',
  );

  zoomPanBehavior = MapZoomPanBehavior(
    zoomLevel: 2,
    focalLatLng: MapLatLng(19.3173, 76.7139),
  );

  random = Random();
  super.initState();
}

@override
Widget build(BuildContext context) {
  final ThemeData themeData = Theme.of(context);
  final TextStyle textStyle = themeData.textTheme.caption!
        .copyWith(color: themeData.colorScheme.surface);
  return Scaffold(
    body: SfMaps(
      layers: [
        MapShapeLayer(
          source: dataSource,
          sublayers: [
            MapPolylineLayer(
              polylines: List<MapPolyline>.generate(
                polylines.length,
                (int index) {
                  return MapPolyline(
                    points: polylines[index].points,
                  );
                },
              ).toSet(),
              tooltipBuilder: (BuildContext context, int index) {
                 return Container(
                    padding: EdgeInsets.only(left: 15, top: 10),
                       width: 150,
                       height: 50,
                       child: Column(
                          children: [
                              Row(
                                children: [
                                   Text('Order item  :  ', style: textStyle),
                                   Text('Pizza', style: textStyle),
                                ],
                              ),
                              Row(
                                children: [
                                   Text('Time left    :  ', style: textStyle),
                                   Text(random.nextInt(30).toString() + ' mins',
                                       style: textStyle),
                                ],
                             ),
                          ],
                       ),
                    );
                 },
            ),
          ],
          zoomPanBehavior: zoomPanBehavior,
        ),
      ],
    ),
  );
}

class PolylineModel {
  PolylineModel(this.points);
  final List<MapLatLng> points;
}
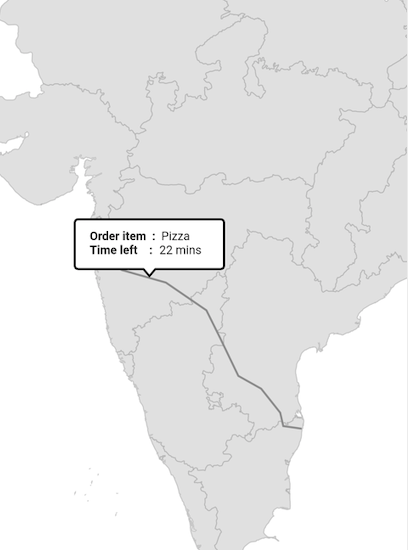
Tooltip customization
You can customize the appearance of the tooltip:
-
Background color - Change the background color of the tooltip in the maps using the
MapTooltipSettings.colorproperty. -
Stroke color - Change the stroke color of the tooltip in the maps using the
MapTooltipSettings.strokeColorproperty. -
Stroke width - Change the stroke width of the tooltip in the maps using the
MapTooltipSettings.strokeWidthproperty.
late List<MapLatLng> polyline;
late List<PolylineModel> polylines;
late MapShapeSource dataSource;
late MapZoomPanBehavior zoomPanBehavior;
late Random random;

@override
void initState() {
  polyline = <MapLatLng>[
    MapLatLng(13.0827, 80.2707),
    MapLatLng(13.1746, 79.6117),
    MapLatLng(13.6373, 79.5037),
    MapLatLng(14.4673, 78.8242),
    MapLatLng(14.9091, 78.0092),
    MapLatLng(16.2160, 77.3566),
    MapLatLng(17.1557, 76.8697),
    MapLatLng(18.0975, 75.4249),
    MapLatLng(18.5204, 73.8567),
    MapLatLng(19.0760, 72.8777),
  ];

  polylines = <PolylineModel>[
    PolylineModel(polyline),
  ];
  dataSource = MapShapeSource.asset(
    'assets/india.json',
    shapeDataField: 'name',
  );

  zoomPanBehavior = MapZoomPanBehavior(
    zoomLevel: 3,
    focalLatLng: MapLatLng(15.3173, 76.7139),
  );

  random = Random();
  super.initState();
}

@override
Widget build(BuildContext context) {
  return Scaffold(
    body: SfMaps(
      layers: [
        MapShapeLayer(
          source: dataSource,
          tooltipSettings: MapTooltipSettings(
            color: Colors.white,
            strokeWidth: 2,
            strokeColor: Colors.black,
          ),
          sublayers: [
            MapPolylineLayer(
              polylines: List<MapPolyline>.generate(
                polylines.length,
                (int index) {
                  return MapPolyline(
                    points: polylines[index].points,
                  );
                },
              ).toSet(),
              tooltipBuilder: (BuildContext context, int index) {
                 return Container(
                    padding: EdgeInsets.only(left: 15, top: 10),
                       width: 150,
                       height: 50,
                       child: Column(
                          children: [
                            Row(
                              children: [
                                Text('Order item :  ',
                                   style: TextStyle(fontWeight: FontWeight.bold)),
                                Text('Pizza'),
                              ],
                            ),
                            Row(
                               children: [
                                  Text('Time left    :  ',
                                      style: TextStyle(fontWeight: FontWeight.bold)),
                                  Text(random.nextInt(30).toString() + ' mins'),
                               ],
                            ),
                          ],
                       ),
                    );
                 },
            ),
          ],
          zoomPanBehavior: zoomPanBehavior,
        ),
      ],
    ),
  );
}

class PolylineModel {
  PolylineModel(this.points);
  final List<MapLatLng> points;
}