Summaries in Flutter Data Grid
18 Nov 201824 minutes to read
Table summary
The SfDataGrid provides built-in support to display concise information about the rows by using the table summary rows. The table summary value is calculated based on all the rows in the DataGridSource.rows property. You can add a table summary row to the DataGrid by adding the GridTableSummaryRow to the SfDataGrid.tableSummaryRows collection.
DataGrid does not automatically display the summary values. To display the summary value, you need to override the buildTableSummaryCellWidget method in the DataGridSource class. The calculated summary value is passed as a parameter to the buildTableSummaryCellWidget method. You must return the required widget with the summary value to render the summary in the grid.
Display table summary for row
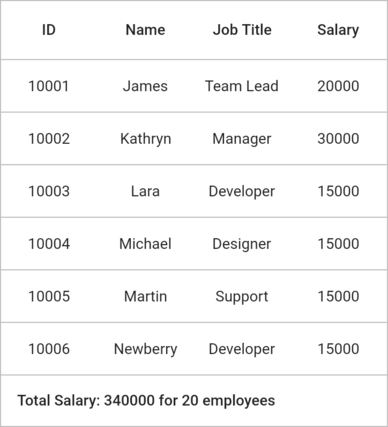
The summary information can be displayed in a row by setting the GridTableSummaryRow.showSummaryInRow property to true and defining the summary columns. The GridTableSummaryRow.title content will be displayed in the corresponding row. You must define the GridTableSummaryRow.title based on the GridSummaryColumn.name property to customize the summary value.
import 'package:flutter/material.dart';
import 'package:syncfusion_flutter_datagrid/datagrid.dart';

class Employee {
  Employee(this.id, this.name, this.designation, this.salary);

  final int id;
  final String name;
  final String designation;
  final int salary;
}

class EmployeeDataSource extends DataGridSource {
  EmployeeDataSource({required List<Employee> employeeData}) {
    _employeeData = employeeData
        .map<DataGridRow>(
          (e) => DataGridRow(
            cells: [
              DataGridCell<int>(columnName: 'id', value: e.id),
              DataGridCell<String>(columnName: 'name', value: e.name),
              DataGridCell<String>(
                columnName: 'designation',
                value: e.designation,
              ),
              DataGridCell<int>(columnName: 'salary', value: e.salary),
            ],
          ),
        )
        .toList();
  }

  List<DataGridRow> _employeeData = [];

  @override
  List<DataGridRow> get rows => _employeeData;

  @override
  Widget? buildTableSummaryCellWidget(
    GridTableSummaryRow summaryRow,
    GridSummaryColumn? summaryColumn,
    RowColumnIndex rowColumnIndex,
    String summaryValue,
  ) {
    return Container(padding: EdgeInsets.all(15.0), child: Text(summaryValue));
  }

  @override
  DataGridRowAdapter buildRow(DataGridRow row) {
    return DataGridRowAdapter(
      cells: row.getCells().map<Widget>((e) {
        return Container(
          alignment: Alignment.center,
          padding: EdgeInsets.all(8.0),
          child: Text(e.value.toString()),
        );
      }).toList(),
    );
  }
}

  @override
  Widget build(BuildContext context) {
    return Scaffold(
      appBar: AppBar(title: const Text('Syncfusion Flutter Data Grid')),
      body: SfDataGrid(
        source: _employeeDataSource,
        tableSummaryRows: [
          GridTableSummaryRow(
            showSummaryInRow: true,
            title: 'Total Salary: {Sum} for 20 employees',
            columns: [
              GridSummaryColumn(
                name: 'Sum',
                columnName: 'salary',
                summaryType: GridSummaryType.sum,
              ),
            ],
            position: GridTableSummaryRowPosition.bottom,
          ),
        ],
        columns: <GridColumn>[
          GridColumn(
            columnName: 'id',
            label: Container(
              padding: EdgeInsets.all(16.0),
              alignment: Alignment.center,
              child: Text('ID'),
            ),
          ),
          GridColumn(
            columnName: 'name',
            label: Container(
              padding: EdgeInsets.all(8.0),
              alignment: Alignment.center,
              child: Text('Name'),
            ),
          ),
          GridColumn(
            columnName: 'designation',
            label: Container(
              padding: EdgeInsets.all(8.0),
              alignment: Alignment.center,
              child: Text('Job Title', overflow: TextOverflow.ellipsis),
            ),
          ),
          GridColumn(
            columnName: 'salary',
            label: Container(
              padding: EdgeInsets.all(8.0),
              alignment: Alignment.center,
              child: Text('Salary'),
            ),
          ),
        ],
      ),
    );
  }
Display table summary for column
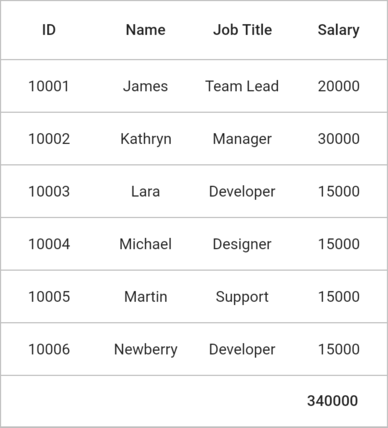
The summary information can be displayed in a column by setting the GridTableSummaryRow.showSummaryInRow property to false. You can define summary columns to the GridTableSummaryRow by adding the GridSummaryColumn to the GridTableSummaryRow.columns collection. The GridSummaryColumn contains the following required properties:
-
name: Defines the summary identifier. This should be a unique name used in the
GridTableSummaryRow.titletemplate. - columnName: Defines the data column name for the summary calculation.
- summaryType: Defines the summary calculation type.
@override
  Widget build(BuildContext context) {
    return Scaffold(
      appBar: AppBar(title: const Text('Syncfusion Flutter Data Grid')),
      body: SfDataGrid(
        source: _employeeDataSource,
        tableSummaryRows: [
          GridTableSummaryRow(
            showSummaryInRow: false,
            columns: [
              GridSummaryColumn(
                name: 'Sum',
                columnName: 'salary',
                summaryType: GridSummaryType.sum,
              ),
            ],
            position: GridTableSummaryRowPosition.bottom,
          ),
        ],
        columns: <GridColumn>[
          GridColumn(
            columnName: 'id',
            label: Container(
              padding: EdgeInsets.all(16.0),
              alignment: Alignment.center,
              child: Text('ID'),
            ),
          ),
          GridColumn(
            columnName: 'name',
            label: Container(
              padding: EdgeInsets.all(8.0),
              alignment: Alignment.center,
              child: Text('Name'),
            ),
          ),
          GridColumn(
            columnName: 'designation',
            label: Container(
              padding: EdgeInsets.all(8.0),
              alignment: Alignment.center,
              child: Text('Job Title', overflow: TextOverflow.ellipsis),
            ),
          ),
          GridColumn(
            columnName: 'salary',
            label: Container(
              padding: EdgeInsets.all(8.0),
              alignment: Alignment.center,
              child: Text('Salary'),
            ),
          ),
        ],
      ),
    );
  }
Positioning table summary row
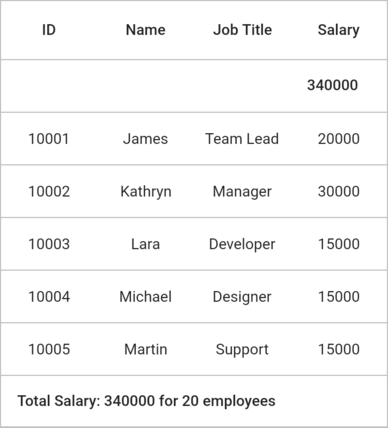
The table summary row can be shown at either the top or bottom position by using the GridTableSummaryRow.position property.
@override
  Widget build(BuildContext context) {
    return Scaffold(
      appBar: AppBar(title: const Text('Syncfusion Flutter Data Grid')),
      body: SfDataGrid(
        source: _employeeDataSource,
        tableSummaryRows: [
          GridTableSummaryRow(
            showSummaryInRow: false,
            columns: [
              GridSummaryColumn(
                name: 'Sum',
                columnName: 'salary',
                summaryType: GridSummaryType.sum,
              ),
            ],
            position: GridTableSummaryRowPosition.top,
          ),
          GridTableSummaryRow(
            showSummaryInRow: true,
            title: 'Total Salary: {Sum} for 20 employees',
            columns: [
              GridSummaryColumn(
                name: 'Sum',
                columnName: 'salary',
                summaryType: GridSummaryType.sum,
              ),
            ],
            position: GridTableSummaryRowPosition.bottom,
          ),
        ],
        columns: <GridColumn>[
          GridColumn(
            columnName: 'id',
            label: Container(
              padding: EdgeInsets.all(16.0),
              alignment: Alignment.center,
              child: Text('ID'),
            ),
          ),
          GridColumn(
            columnName: 'name',
            label: Container(
              padding: EdgeInsets.all(8.0),
              alignment: Alignment.center,
              child: Text('Name'),
            ),
          ),
          GridColumn(
            columnName: 'designation',
            label: Container(
              padding: EdgeInsets.all(8.0),
              alignment: Alignment.center,
              child: Text('Job Title', overflow: TextOverflow.ellipsis),
            ),
          ),
          GridColumn(
            columnName: 'salary',
            label: Container(
              padding: EdgeInsets.all(8.0),
              alignment: Alignment.center,
              child: Text('Salary'),
            ),
          ),
        ],
      ),
    );
  }
Summary calculation types
The GridSummaryType enum defines the following calculation types for summary rows:
- Sum: Calculates the total sum of all numeric values in the specified column.
- Average: Calculates the arithmetic mean of all numeric values in the specified column.
- Count: Calculates the total number of rows in the DataGrid, including the data rows but excluding the header and summary rows.
- Maximum: Calculates the maximum (largest) value in the specified column.
- Minimum: Calculates the minimum (smallest) value in the specified column.
Display table summary row with title
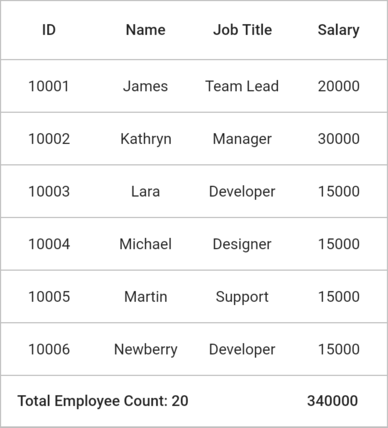
The SfDataGrid supports displaying a summary title along with column summary values by using the GridTableSummaryRow.title and GridTableSummaryRow.titleColumnSpan properties. Column summary with title is only supported when GridTableSummaryRow.showSummaryInRow is false. The titleColumnSpan property specifies how many columns the title should span from the left side of the summary row.
@override
  Widget build(BuildContext context) {
    return Scaffold(
      appBar: AppBar(title: const Text('Syncfusion Flutter Data Grid')),
      body: SfDataGrid(
        source: _employeeDataSource,
        tableSummaryRows: [
          GridTableSummaryRow(
            showSummaryInRow: false,
            title: 'Total Employee Count: {Count}',
            titleColumnSpan: 3,
            columns: [
              GridSummaryColumn(
                name: 'Count',
                columnName: 'id',
                summaryType: GridSummaryType.count,
              ),
              GridSummaryColumn(
                name: 'Sum',
                columnName: 'salary',
                summaryType: GridSummaryType.sum,
              ),
            ],
            position: GridTableSummaryRowPosition.bottom,
          ),
        ],
        columns: <GridColumn>[
          GridColumn(
            columnName: 'id',
            label: Container(
              padding: EdgeInsets.all(16.0),
              alignment: Alignment.center,
              child: Text('ID'),
            ),
          ),
          GridColumn(
            columnName: 'name',
            label: Container(
              padding: EdgeInsets.all(8.0),
              alignment: Alignment.center,
              child: Text('Name'),
            ),
          ),
          GridColumn(
            columnName: 'designation',
            label: Container(
              padding: EdgeInsets.all(8.0),
              alignment: Alignment.center,
              child: Text('Job Title', overflow: TextOverflow.ellipsis),
            ),
          ),
          GridColumn(
            columnName: 'salary',
            label: Container(
              padding: EdgeInsets.all(8.0),
              alignment: Alignment.center,
              child: Text('Salary'),
            ),
          ),
        ],
      ),
    );
  }
Set the background color for the table summary row
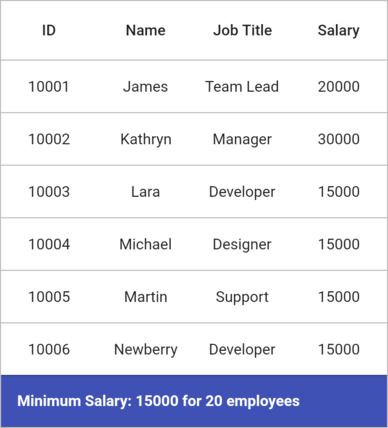
The background color of the table summary row can be customized by using the GridTableSummaryRow.color property.
@override
  Widget build(BuildContext context) {
    return Scaffold(
      appBar: AppBar(title: const Text('Syncfusion Flutter Data Grid')),
      body: SfDataGrid(
        source: _employeeDataSource,
        tableSummaryRows: [
          GridTableSummaryRow(
            color: Colors.indigo,
            showSummaryInRow: true,
            title: 'Minimum Salary: {Minimum} for 20 employees',
            columns: [
              GridSummaryColumn(
                name: 'Minimum',
                columnName: 'salary',
                summaryType: GridSummaryType.minimum,
              ),
            ],
            position: GridTableSummaryRowPosition.bottom,
          ),
        ],
        columns: <GridColumn>[
          GridColumn(
            columnName: 'id',
            label: Container(
              padding: EdgeInsets.all(16.0),
              alignment: Alignment.center,
              child: Text('ID'),
            ),
          ),
          GridColumn(
            columnName: 'name',
            label: Container(
              padding: EdgeInsets.all(8.0),
              alignment: Alignment.center,
              child: Text('Name'),
            ),
          ),
          GridColumn(
            columnName: 'designation',
            label: Container(
              padding: EdgeInsets.all(8.0),
              alignment: Alignment.center,
              child: Text('Job Title', overflow: TextOverflow.ellipsis),
            ),
          ),
          GridColumn(
            columnName: 'salary',
            label: Container(
              padding: EdgeInsets.all(8.0),
              alignment: Alignment.center,
              child: Text('Salary'),
            ),
          ),
        ],
      ),
    );
  }
Customize table summary calculation
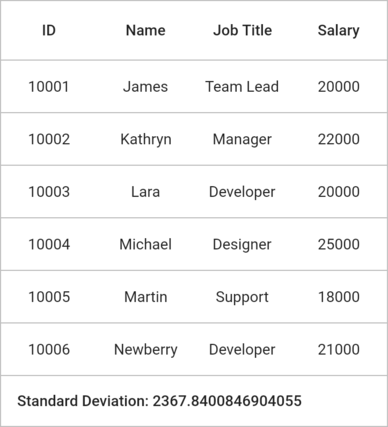
You can write custom logic for the summary calculation by overriding the calculateSummaryValue method from the DataGridSource class. The summaryColumn parameter will be null for the summary cells in spanned summary columns.
The following example demonstrates how to customize the summary calculation to find the standard deviation for all employees’ salaries.
import 'dart:math';
import 'package:collection/collection.dart';
import 'package:syncfusion_flutter_datagrid/datagrid.dart';
import 'package:flutter/material.dart';

class EmployeeDataSource extends DataGridSource {
  EmployeeDataSource({required List<Employee> employeeData}) {
    _employeeData = employeeData
        .map<DataGridRow>(
          (e) => DataGridRow(
            cells: [
              DataGridCell<int>(columnName: 'id', value: e.id),
              DataGridCell<String>(columnName: 'name', value: e.name),
              DataGridCell<String>(
                columnName: 'designation',
                value: e.designation,
              ),
              DataGridCell<int>(columnName: 'salary', value: e.salary),
            ],
          ),
        )
        .toList();
  }

  List<DataGridRow> _employeeData = [];

  @override
  List<DataGridRow> get rows => _employeeData;

  @override
  String calculateSummaryValue(
    GridTableSummaryRow summaryRow,
    GridSummaryColumn? summaryColumn,
    RowColumnIndex rowColumnIndex,
  ) {
    List<int> getCellValues(GridSummaryColumn summaryColumn) {
      final List<int> values = <int>[];
      for (final DataGridRow row in rows) {
        final DataGridCell? cell = row.getCells().firstWhereOrNull(
          (DataGridCell element) =>
              element.columnName == summaryColumn.columnName,
        );
        if (cell != null && cell.value != null) {
          values.add(cell.value as int);
        }
      }
      return values;
    }

    String? title = summaryRow.title;
    if (title != null) {
      if (summaryRow.showSummaryInRow && summaryRow.columns.isNotEmpty) {
        for (final GridSummaryColumn summaryColumn in summaryRow.columns) {
          if (title!.contains(summaryColumn.name)) {
            double deviation = 0;
            final List<int> values = getCellValues(summaryColumn);
            if (values.isNotEmpty) {
              final double average = values.average;
              double variance = 0;
              for (final int value in values) {
                variance += pow(value - average, 2) as double;
              }
              deviation = sqrt(variance / (values.length - 1));
            }
            title = title.replaceAll(
              '{${summaryColumn.name}}',
              deviation.toStringAsFixed(2),
            );
          }
        }
      }
    }
    return title ?? '';
  }

  @override
  Widget? buildTableSummaryCellWidget(
    GridTableSummaryRow summaryRow,
    GridSummaryColumn? summaryColumn,
    RowColumnIndex rowColumnIndex,
    String summaryValue,
  ) {
    return Container(padding: EdgeInsets.all(15.0), child: Text(summaryValue));
  }

  @override
  DataGridRowAdapter buildRow(DataGridRow row) {
    return DataGridRowAdapter(
      cells: row.getCells().map<Widget>((e) {
        return Container(
          alignment: Alignment.center,
          padding: EdgeInsets.all(8.0),
          child: Text(e.value.toString()),
        );
      }).toList(),
    );
  }
}

  @override
  Widget build(BuildContext context) {
    return Scaffold(
      appBar: AppBar(title: const Text('Syncfusion Flutter Data Grid')),
      body: SfDataGrid(
        source: _employeeDataSource,
        tableSummaryRows: [
          GridTableSummaryRow(
            showSummaryInRow: true,
            title: 'Standard Deviation: {Deviation}',
            columns: [
              GridSummaryColumn(
                name: 'Deviation',
                columnName: 'salary',
                summaryType: GridSummaryType.sum,
              ),
            ],
            position: GridTableSummaryRowPosition.bottom,
          ),
        ],
        columns: <GridColumn>[
          GridColumn(
            columnName: 'id',
            label: Container(
              padding: EdgeInsets.all(16.0),
              alignment: Alignment.center,
              child: Text('ID'),
            ),
          ),
          GridColumn(
            columnName: 'name',
            label: Container(
              padding: EdgeInsets.all(8.0),
              alignment: Alignment.center,
              child: Text('Name'),
            ),
          ),
          GridColumn(
            columnName: 'designation',
            label: Container(
              padding: EdgeInsets.all(8.0),
              alignment: Alignment.center,
              child: Text('Job Title', overflow: TextOverflow.ellipsis),
            ),
          ),
          GridColumn(
            columnName: 'salary',
            label: Container(
              padding: EdgeInsets.all(8.0),
              alignment: Alignment.center,
              child: Text('Salary'),
            ),
          ),
        ],
      ),
    );
  }