Waterfall Chart in Flutter Cartesian Charts (SfCartesianChart)
21 May 2021 / 8 minutes to read
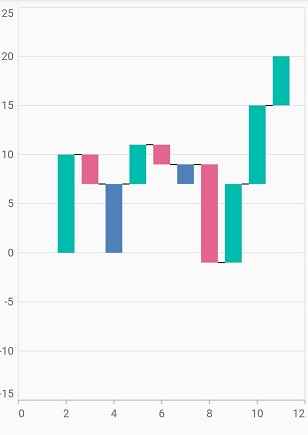
The waterfall chart explains gradual changes in the quantitative value of an entity that is subject to changes by increments or decrements. Using the waterfall chart, you can quickly illustrate changes in revenues.
To render a waterfall chart, create an instance of WaterfallSeries and add to theseriescollection property of SfCartesianChart. The following properties to customize the appearance.
-
negativePointsColor- changes the color of the negative data points in the series. If no color is specified, then the negative data points will be rendered with the series default color. -
intermediateSumColor- changes the Color of the intermediate sum points in the series. If no color is specified, then the intermediate sum points will be rendered with the series default color. -
totalSumColor- changes the color of the total sum points in the series. If no color is specified, then the total sum points will be rendered with the series default color. -
connectorLineSettings- used to customize the waterfall chart connector line. Data points in waterfall chart are connected using the connector line. Provides the options to change thewidth,coloranddashArrayof the connector line to customize the appearance. -
spacing- used to provide spacing between the data points in waterfall chart. The value ranges from 0 to 1, where 1 represents 100% and 0 represents 0% of the available space.
@override
    Widget build(BuildContext context) {
        return Scaffold(
            body: Center(
                child: Container(
                    child: SfCartesianChart(
                        series: <ChartSeries<SalesData, double>>[
                            WaterfallSeries<SalesData, double>(
                                dataSource: <SalesData>[
                                    SalesData(2, 10, Colors.red),
                                    SalesData(3, -3, Colors.green),
                                    SalesData(4, 5, Colors.red, true),
                                    SalesData(5, 4, Colors.blue),
                                    SalesData(6, -2, Colors.red),
                                    SalesData(7, -5, Colors.red, true),
                                    SalesData(8, -10, Colors.red),
                                    SalesData(9, 8, Colors.red),
                                    SalesData(10, 8, Colors.red),
                                    SalesData(11, 5, Colors.red),
                                    SalesData(12, 8, Colors.red, false),
                                    SalesData(13, -5, Colors.red, false, true),
                                ],
                                negativePointsColor: const Color.fromRGBO(229, 101, 144, 1),
                                intermediateSumColor: const Color.fromRGBO(79, 129, 188, 1),
                                totalSumColor: const Color.fromRGBO(79, 129, 188, 1),
                                xValueMapper: (SalesData sales, _) => sales.x,
                                yValueMapper: (SalesData sales, _) => sales.y,
                                intermediateSumPredicate: (SalesData sales, _) => sales.isIntermediate,
                                totalSumPredicate: (SalesData sales, _) => sales.isTotal,
                                connectorLineSettings: WaterfallConnectorLineSettings(
                                    width: 2.5
                                )
                            )
                        ]
                    )
                )
            )
        );
    }
Was this page helpful?
Yes
No
Thank you for your feedback!
Thank you for your feedback and comments. We will rectify this as soon as possible!
An unknown error has occurred. Please try again.
Help us improve this page