Step line Chart in Flutter Cartesian Charts (SfCartesianChart)
21 May 2021 / 5 minutes to read
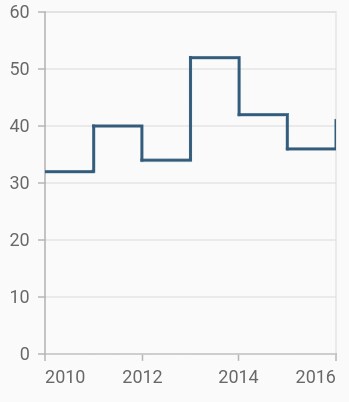
To render a step line chart, create an instance of StepLineSeries, and add it to the series collection property of SfCartesianChart. The following properties can be used to customize the appearance of spline segment:
-
color- changes the color of the line. -
opacity- controls the transparency of the chart series. -
width- changes the stroke width of the line.
@override
    Widget build(BuildContext context) {
         return Scaffold(
            body: Center(
                child: Container(
                    child: SfCartesianChart(
                        primaryXAxis: DateTimeAxis(),
                        series: <ChartSeries>[
                            // Renders step line chart
                            StepLineSeries<ChartData, DateTime>(
                                dataSource: chartData,
                                xValueMapper: (ChartData sales, _) => sales.x,
                                yValueMapper: (ChartData sales, _) => sales.y
                            )
                        ]
                    )
                )
            )
        );
    }
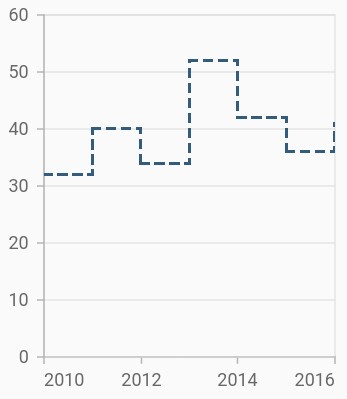
Dashed step line
The dashArray property of the StepLineSeries is used to render step line series with dashes. Odd value is considered as rendering size and even value is considered as gap.
@override
    Widget build(BuildContext context) {
         return Scaffold(
            body: Center(
                child: Container(
                    child: SfCartesianChart(
                        primaryXAxis: DateTimeAxis(),
                        series: <ChartSeries>[
                            StepLineSeries<ChartData, DateTime>(
                                dataSource: chartData,
                                // Dashes for step line
                                dashArray: <double>[5, 5],
                                xValueMapper: (ChartData sales, _) => sales.x,
                                yValueMapper: (ChartData sales, _) => sales.y
                            )
                        ]
                    )
                )
            )
        );
    }
Also refer, color palette, color mapping, animation, gradient and empty points for customizing the step line series further.
Was this page helpful?
Yes
No
Thank you for your feedback!
Thank you for your feedback and comments. We will rectify this as soon as possible!
An unknown error has occurred. Please try again.
Help us improve this page