100% Stacked column in Flutter Cartesian Charts (SfCartesianChart)
21 May 2021 / 10 minutes to read
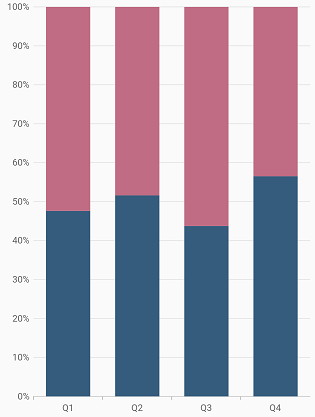
To render a 100% stacked column chart, create an instance of StackedColumn100Series, and add it to the series collection property of SfCartesianChart. The following properties can be used to customize the appearance:
-
color- changes the color of the series. -
opacity- controls the transparency of the chart series. -
borderWidth- changes the stroke width of the series. -
borderColor- changes the stroke color of the series. -
borderRadius- used to add the rounded corners to the rectangle.
@override
    Widget build(BuildContext context) {
        return Scaffold(
            body: Center(
                child: Container(
                    child: SfCartesianChart(
                        primaryXAxis: CategoryAxis(),
                        series: <ChartSeries>[
                            StackedColumn100Series<SalesData, String>(
                                dataSource: chartData,
                                xValueMapper: (SalesData sales, _) => sales.year,
                                yValueMapper: (SalesData sales, _) => sales.sales
                            ),
                            StackedColumn100Series<SalesData, String>(
                                dataSource: chartData,
                                xValueMapper: (SalesData sales, _) => sales.year,
                                yValueMapper: (SalesData sales, _) => sales.sales2
                            ),
                            StackedColumn100Series<SalesData, String>(
                                dataSource: chartData,
                                xValueMapper: (SalesData sales, _) => sales.year,
                                yValueMapper: (SalesData sales, _) => sales.sales3
                            ),
                            StackedColumn100Series<SalesData, String>(
                                dataSource: chartData,
                                xValueMapper: (SalesData sales, _) => sales.year,
                                yValueMapper: (SalesData sales, _) => sales.sales4
                            )
                        ]
                    )
                )
            )
        );
    }
Column width and spacing
The spacing property is used to change the spacing between two segments. The default value of spacing is 0, and the value ranges from 0 to 1. Here, 1 and 0 correspond to 100% and 0% of the available space, respectively.
The width property is used to change the width of the rectangle. The default value of the width is 0.7, and the value ranges from 0 to 1. Here, 1 and 0 correspond to 100% and 0% of the available width, respectively.
@override
    Widget build(BuildContext context) {
        return Scaffold(
            body: Center(
                child: Container(
                    child: SfCartesianChart(
                        primaryXAxis: CategoryAxis(),
                        series: <ChartSeries>[
                            StackedColumn100Series<SalesData, String>(
                                dataSource: chartData,
                                xValueMapper: (SalesData sales, _) => sales.year,
                                yValueMapper: (SalesData sales, _) => sales.sales,
                                width: 0.8, // Width of the columns
                                spacing: 0.2 // Spacing between the columns
                            ),
                            StackedColumn100Series<SalesData, String>(
                                dataSource: chartData,
                                xValueMapper: (SalesData sales, _) => sales.year,
                                yValueMapper: (SalesData sales, _) => sales.sales2,
                                width: 0.8, // Width of the columns
                                spacing: 0.2 // Spacing between the columns
                            )
                        ]
                    )
                )
            )
        );
    }
Was this page helpful?
Yes
No
Thank you for your feedback!
Thank you for your feedback and comments. We will rectify this as soon as possible!
An unknown error has occurred. Please try again.
Help us improve this page