Having trouble getting help?
Contact Support
Contact Support
100% Stacked bar Chart in Flutter Cartesian Charts (SfCartesianChart)
21 May 2021 / 10 minutes to read
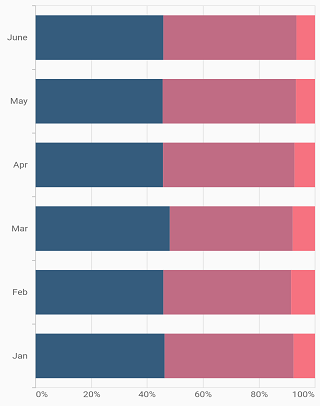
To render a 100% stacked bar chart, create an instance of StackedBar100Series, and add it to the series collection property of SfCartesianChart. The following properties can be used to customize the appearance:
-
color- changes the color of the series. -
opacity- controls the transparency of the chart series. -
borderWidth- changes the stroke width of the series. -
borderColor- changes the stroke color of the series. -
borderRadius- used to add the rounded corners to the rectangle.
@override
    Widget build(BuildContext context) {
        return Scaffold(
            body: Center(
                child: Container(
                    child: SfCartesianChart(
                        primaryXAxis: CategoryAxis(),
                        series: <ChartSeries>[
                            StackedBar100Series<SalesData, String>(
                                dataSource: chartData,
                                xValueMapper: (SalesData sales, _) => sales.year,
                                yValueMapper: (SalesData sales, _) => sales.sales
                            ),
                            StackedBar100Series<SalesData, String>(
                                dataSource: chartData,
                                xValueMapper: (SalesData sales, _) => sales.year,
                                yValueMapper: (SalesData sales, _) => sales.sales2
                            ),
                            StackedBar100Series<SalesData, String>(
                                dataSource: chartData,
                                xValueMapper: (SalesData sales, _) => sales.year,
                                yValueMapper: (SalesData sales, _) => sales.sales3
                            ),
                            StackedBar100Series<SalesData, String>(
                                dataSource: chartData,
                                xValueMapper: (SalesData sales, _) => sales.year,
                                yValueMapper: (SalesData sales, _) => sales.sales4
                            )
                        ]
                    )
                )
            )
        );
    }
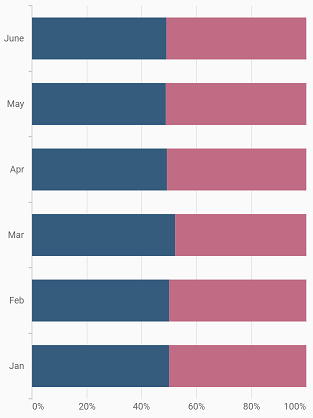
Bar width and spacing
The spacing property is used to change the spacing between two segments. The default value of spacing is 0, and the value ranges from 0 to 1. Here, 1 and 0 correspond to 100% and 0% of the available space, respectively.
The width property is used to change the width of the rectangle. The default value of the width is 0.7, and the value ranges from 0 to 1. Here, 1 and 0 correspond to 100% and 0% of the available width, respectively.
@override
    Widget build(BuildContext context) {
        return Scaffold(
            body: Center(
                child: Container(
                    child: SfCartesianChart(
                        primaryXAxis: CategoryAxis(),
                        series: <ChartSeries>[
                            StackedBar100Series<SalesData, String>(
                                dataSource: chartData,
                                xValueMapper: (SalesData sales, _) => sales.year,
                                yValueMapper: (SalesData sales, _) => sales.sales,
                                width: 0.8,
                                spacing: 0.2
                            ),
                            StackedBar100Series<SalesData, String>(
                                dataSource: chartData,
                                xValueMapper: (SalesData sales, _) => sales.year,
                                yValueMapper: (SalesData sales, _) => sales.sales2,
                                width: 0.8,
                                spacing: 0.2
                            )
                        ]
                    )
                )
            )
        );
    }
Was this page helpful?
Yes
No
Help us improve this page