Spline range area Chart in Flutter Cartesian Charts (SfCartesianChart)
21 May 2021 / 8 minutes to read
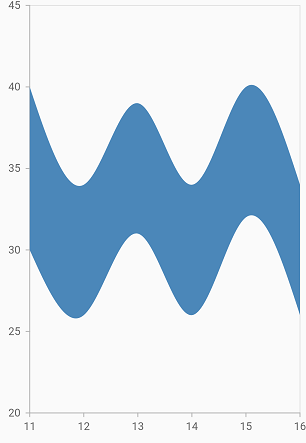
To render a spline range area chart, create an instance of the SplineRangeAreaSeries, and add to the series collection property of SfCartesianChart.
SplineRangeAreaSeries requires two Y values for a point, data should contain high and low values. The high and low values specify the maximum and minimum ranges of a point.
-
highValueMapper- field in the data source, which is considered as high value for the data points. -
lowValueMapper- field in the data source, which is considered as low value for the data points.
@override
    Widget build(BuildContext context) {
        return Scaffold(
            body: Center(
                child: Container(
                    child: SfCartesianChart(
                        series: <CartesianSeries<SalesData, num>>[
                        SplineRangeAreaSeries<SalesData, num>(
                          dataSource: chartData,
                          xValueMapper: (SalesData sales, _) => sales.xValue,
                          lowValueMapper: (SalesData sales, _) =>
                              sales.lowValue,
                          highValueMapper: (SalesData sales, _) =>
                              sales.highValue,),
                    ]
                )
             )
          )
       );
    }
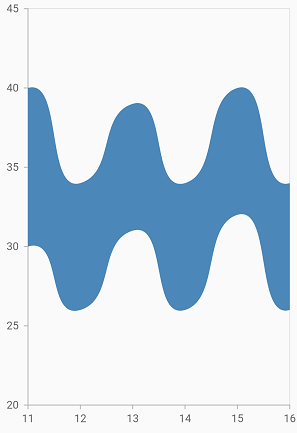
Spline rendering types
The splineType allows you to change the spline curve in series. The following types can be used in SplineRangeAreaSeries.
- natural
- monotonic
- cardinal
- clamped
By default, the value of splineType is natural.
The following code sample demonstrates how to set the splineType value to cardinal. When you set the cardinal type, you can specify the desired line tension of the cardinal spline using the cardinalSplineTension property. The value of this property ranges from 0 to 1.
@override
    Widget build(BuildContext context) {
        return Scaffold(
            body: Center(
                child: Container(
                    child: SfCartesianChart(
                        series: <CartesianSeries<SalesData, num>>[
                            SplineRangeAreaSeries<SalesData, num>(
                                dataSource: chartData,
                                splineType: SplineType.cardinal,
                                cardinalSplineTension: 0.8,
                                xValueMapper: (SalesData sales, _) => sales.xValue,
                                lowValueMapper: (SalesData sales, _) => sales.lowValue,
                                highValueMapper: (SalesData sales, _) => sales.highValue
                            )
                        ]
                    )
                )
            )
        );
    }
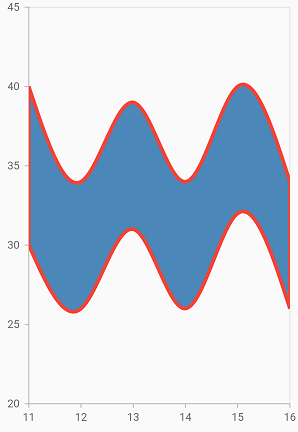
Border customization
The borders of the spline range area chart can be customized using the borderDrawMode property. The default value of the borderDrawMode property is all and the other value is excludeSides.
@override
    Widget build(BuildContext context) {
        return Scaffold(
            body: Center(
                child: Container(
                    child: SfCartesianChart(
                        series: <CartesianSeries<SalesData, num>>[
                            SplineRangeAreaSeries<SalesData, num>(
                                borderDrawMode: RangeAreaBorderMode.all,
                                borderWidth:2,
                                borderColor: Colors.red
                            )
                        ]
                    )
                )
            )
        );
    }