Open High Low Close in Flutter Cartesian Charts (SfCartesianChart)
21 May 2021 / 11 minutes to read
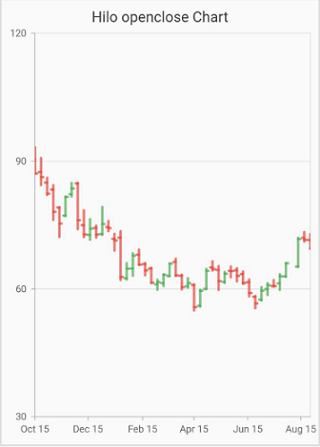
OpenHighLowClose series is used to represent the low, high, open and closing values over time.
To render a OpenHighLowClose chart, create an instance of hiloOpenCloseSeries, and add it to the series collection property of SfCartesianChart. The following properties can be used to customize the appearance:
-
color- changes the color of the series. -
opacity- controls the transparency of the chart series. -
borderWidth- changes the stroke width of the series. -
borderColor- changes the stroke color of the series. -
showIndicationForSameValues- used to show indication of the data point with a thin line when its high and low values are same and also when all the values of high, low, open and close are same for the data point. By default is set to befalse. -
lowValueMapper- used to get the low values from the series. -
highValueMapper- used to get the high values from the series. -
openValueMapper- used to get the open values from the series. -
closeValueMapper- used to get the close values from the series. -
bearFillColor- bearFillColor will be applied when the opening value is less than the closing value. -
bullFillColor- bullFillColor will be applied when the opening value is greater than closing value.
@override
    Widget build(BuildContext context) {
        return Scaffold(
            body: Center(
                child: Container(
                    child: SfCartesianChart(
                        primaryXAxis: DateTimeAxis(),
                        series: <ChartSeries>[
                            // Renders hiloOpenCloseSeries
                            hiloOpenCloseSeries<SalesData, DateTime>(
                                dataSource: chartData,
                                xValueMapper: (SalesData sales, _) => sales.year,
                                lowValueMapper: (Sample sales, _) => sales.low,
                                highValueMapper: (Sample sales, _) => sales.high,
                                openValueMapper: (Sample sales, _) => sales.open,
                                closeValueMapper: (Sample sales, _) => sales.close,

                            )
                        ]
                    )
                )
            )
        );
    }
Indication for same values
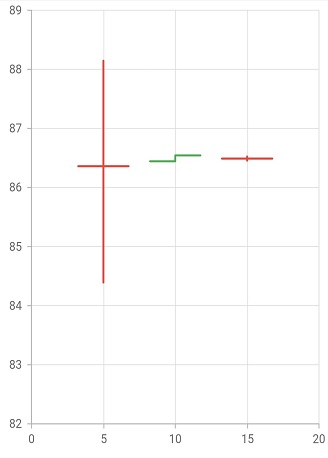
In the OHLC series, there is a feature for the datapoints indication when their high and low values are same or open and close values or high, low, open and close values are same for a datapoint. For using this indication feature, showIndicationForSameValues property can be set to true.
The following are the types of indication when the combination of high, low, open and close values are same for a datapoint.
- In the OHLC chart, if the open and close values are same then a horizontal line will be drawn at that value by default.
- If the high and low values are same and with
showIndicationForSameValuesproperty set to true then, a thin vertical line is drawn and if API is set to false, the line will not be drawn.
@override
    Widget build(BuildContext context) {
        return Scaffold(
            body: Center(
                child: SfCartesianChart(
                        series: <ChartSeries>[
                          HiloOpenCloseSeries<ChartData, double>(
                            showIndicationForSameValues: true,
                            dataSource: <ChartData>[
                                ChartData( // Open and close values are same
                                    x: 5,
                                    open: 85.3593,
                                    high: 88.1435,
                                    low: 84.3914,
                                    close: 85.3593),
                                ChartData( // High and low values are same
                                    x: 10,
                                    open: 86.4425,
                                    high: 86.4885,
                                    low: 86.4885,
                                    close: 86.5443),
                                ChartData( //High, low, open, and close values all are same
                                    x: 15,
                                    open: 86.4885,
                                    high: 86.4885,
                                    low: 86.4885,
                                    close: 86.4885),
                            ],
                            xValueMapper: (ChartData data, _) => data.x,
                            highValueMapper: (ChartData data, _) => data.high,
                            lowValueMapper: (ChartData data, _) => data.low,
                            openValueMapper: (ChartData data, _) => data.open,
                            closeValueMapper: (ChartData data, _) => data.close)
                        ]
                    ),
                )
            )
        );
    }
Was this page helpful?
Yes
No
Thank you for your feedback!
Thank you for your feedback and comments. We will rectify this as soon as possible!
An unknown error has occurred. Please try again.
Help us improve this page