Fast line Chart in Flutter Cartesian Charts (SfCartesianChart)
21 May 2021 / 3 minutes to read
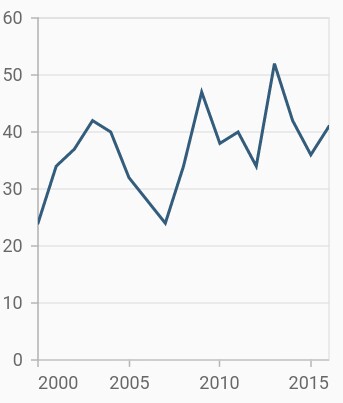
FastLineSeries is a line chart, but it loads faster than LineSeries. You can use this when there are large number of points to be loaded in a chart. To render a fast line chart, create an instance of FastLineSeries, and add it to the series collection property of SfCartesianChart. The following properties can be used to customize the appearance of fast line segment:
-
color- changes the color of the line. -
opacity- controls the transparency of the chart series. -
width- changes the stroke width of the line.
@override
    Widget build(BuildContext context) {
        return Scaffold(
            body: Center(
                child: Container(
                    child: SfCartesianChart(
                        primaryXAxis: DateTimeAxis(),
                        series: <ChartSeries>[
                            // Renders fast line chart
                            FastLineSeries<SalesData, DateTime>(
                                dataSource: chartData,
                                xValueMapper: (SalesData sales, _) => sales.year,
                                yValueMapper: (SalesData sales, _) => sales.sales
                            )
                        ]
                    )
                )
            )
        );
    }
Also refer, color palette, color mapping, animation, gradient and empty points for customizing the fast line series further.
Was this page helpful?
Yes
No
Thank you for your feedback!
Thank you for your feedback and comments. We will rectify this as soon as possible!
An unknown error has occurred. Please try again.
Help us improve this page