Circular series customization
Animation
SfCircularChart provides animation support for the series. Series will be animated while rendering. Animation is enabled by default, you can also control the duration of the animation using animationDuration property. You can disable the animation by setting 0 value to that property.
@override
    Widget build(BuildContext context) {
        return Scaffold(
            body: Center(
                child: Container(
                    child: SfCircularChart(series: <CircularSeries<ChartData,dynamic>>[
                        // Render pie chart
                        PieSeries<ChartData, String>(
                            dataSource: chartData,
                            pointColorMapper:(ChartData data,  _) => data.color,
                            xValueMapper: (ChartData data, _) => data.x,
                            yValueMapper: (ChartData data, _) => data.y,
                            animationDuration: 1000
                        )
                    ]
                )
            )
        )
    );
    }}
Dynamic animation
SfCircularChart also provide the dynamic animation support for the series.The series can be dynamically added to the charts, it will animated by setting the timer value. when you set the animationDuration value to 0, the series won’t be animated.
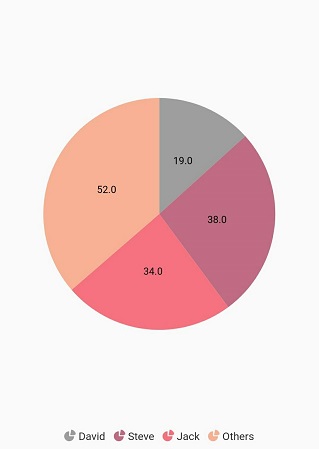
Empty points
The data points that has null value are considered as empty points. Empty data points are ignored and not plotted in the chart. By using emptyPointSettings property in series, you can decide the action taken for empty points. Available modes are gap, zero, drop and average. Default mode of the empty point is gap.
@override
    Widget build(BuildContext context) {

         final List<ChartData> chartData = [
            ChartData('David', null),
            ChartData('Steve', 38),
            ChartData('Jack', 34),
            ChartData('Others', 52)
        ];
        return Scaffold(
            body: Center(
                child: SfCircularChart(
                    series: <CircularSeries<ChartData,dynamic>>[
                        // Render pie chart
                        PieSeries<ChartData, String>(
                            dataSource: chartData,
                            dataLabelSettings: DataLabelSettings(isVisible:true),
                            emptyPointSettings:
                      EmptyPointSettings(mode: EmptyPointMode.average),
                            pointColorMapper:(ChartData data,  _) => data.color,
                            xValueMapper: (ChartData data, _) => data.x,
                            yValueMapper: (ChartData data, _) => data.y,)])));
    }}
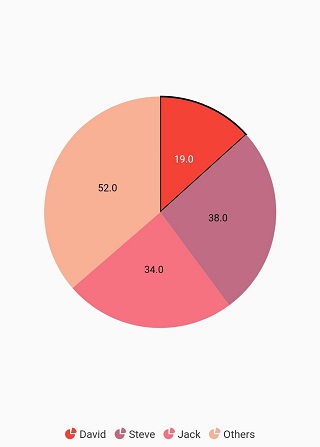
Empty point customization
Specific color for empty point can be set by color property in emptyPointSettings. The borderWidth property is used to change the stroke width of the empty point and borderColor is used to change the stroke color of the empty point.
@override
    Widget build(BuildContext context) {
     final List<ChartData> chartData = [
      ChartData('David', null),
      ChartData('Steve', 38),
      ChartData('Jack', 34),
      ChartData('Others', 52)
    ];
    return Scaffold(
        body: Center(
            child: Container(
                child: SfCircularChart(
                    series: <CircularSeries<ChartData, dynamic>>[
          PieSeries<ChartData, String>(
              dataSource: chartData,
              dataLabelSettings: DataLabelSettings(isVisible: true),
              emptyPointSettings: EmptyPointSettings(
                  mode: EmptyPointMode.average,
                  color: Colors.red,
                  borderColor: Colors.black,
                  borderWidth: 2),
              xValueMapper: (ChartData data, _) => data.x,
              yValueMapper: (ChartData data, _) => data.y)
        ]))));
      }}
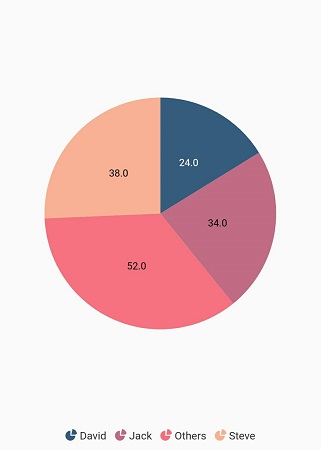
Sorting
The chart’s data source can be sorted using the sortingOrder and sortFieldValueMapper properties of series. The sortingOrder property specifies the data points in the series can be sorted in ascending or descending order. The data points will be rendered in the specified order if sortingOrder is set to none. The sortFieldValueMapper specifies the field in the data source, which is considered for sorting the data points.
@override
    Widget build(BuildContext context) {

         final List<ChartData> chartData = [
            ChartData('David', 25),
            ChartData('Steve', 38),
            ChartData('Jack', 34),
            ChartData('Others', 52)
        ];

        return Scaffold(
            body: Center(
                child: Container(
                    child: SfCircularChart(

                      series: <CircularSeries<ChartData,dynamic>>[
                        // Render pie chart
                        PieSeries<ChartData, String>(
                            dataSource: chartData,
                            dataLabelSettings: DataLabelSettings(isVisible:true),
                            sortingOrder: SortingOrder.ascending,
                            sortFieldValueMapper: (ChartData data, _) => data.x,
                            pointColorMapper:(ChartData data,  _) => data.color,
                            xValueMapper: (ChartData data, _) => data.x,
                            yValueMapper: (ChartData data, _) => data.y,
                            animationDuration: 1000
                        )]))));
    }}
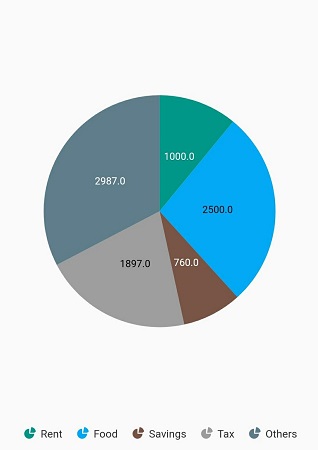
Color mapping for data points
The pointColorMapper property is used to map the color field from the data source.
@override
     Widget build(BuildContext context) {
    static dynamic chartData = <SalesData>[
    SalesData('Rent', 1000,Colors.teal),
    SalesData('Food', 2500,Colors.lightBlue),
    SalesData('Savings', 760,Colors.brown),
    SalesData('Tax', 1897,Colors.grey),
    SalesData('Others', 2987,Colors.blueGrey)
     ];
        return Scaffold(
            body: Center(
                child: Container(
                    child: SfCircularChart(
                        primaryXAxis: CategoryAxis(),
                        series: <PieSeries<SalesData, String>>[
                            PieSeries<SalesData, String>(
                                dataSource: chartData,
              xValueMapper: (SalesData sales, _) => sales.year,
              yValueMapper: (SalesData sales, _) => sales.sales,
              //map Color for each dataPoint datasource.
              pointColorMapper: (SalesData sales,_) => sales.color,
                            )
                        ]
                    )
                )
            )
        );
    }