Annotation in Syncfusion flutter charts
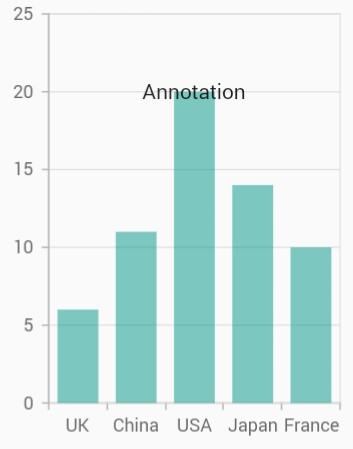
Chart supports annotations which allows you to mark the specific area of interest in the chart area. You can add the custom widgets using this annotations feature as depicted below.
@override
    Widget build(BuildContext context) {
      return Scaffold(
        body: SafeArea(
          child: Center(
            child: Container(
              child: SfCartesianChart(
                annotations: <CartesianChartAnnotation>[
                  CartesianChartAnnotation(
                    widget:
                      Container(
                        child: const Text('Annotation')
                      ),
                    coordinateUnit: CoordinateUnit.point,
                    x: 'USA',
                    y: 20
                  )
                ]
              )
            )
          )
        )
      );
    }
Positioning the annotation
The x and y values can be specified with axis units or pixel units, and these can be identified by using coordinateUnit property. When logicalPixel is specified, the annotation will be placed with respect to pixel values whereas point is specified, then the annotation will be placed with respect to series point values.
Positioning based on coordinateUnit as point
To position the annotation based on axis, set the x and yproperties based on axis range values, and set the coordinateUnit value as point.
@override
    Widget build(BuildContext context) {
      return Scaffold(
        body: SafeArea(
          child: Center(
            child: Container(
              child: SfCartesianChart(
                annotations: <CartesianChartAnnotation>[
                  CartesianChartAnnotation(
                    widget: Container(
                      child: const Text('Text')
                    ),
                    coordinateUnit: CoordinateUnit.point,
                    x: 20, // x position of annotation
                    y: 40 // y position of annotation
                  )
                ]
              )
            )
          )
        )
      );
    }
Positioning based on coordinateUnit as pixels
To position the annotation based on the pixel values, set the CoordinateUnit value as logicalPixel, and the pixel values in x and y properties of annotation are shown in the following code snippet.
@override
    Widget build(BuildContext context) {
      return Scaffold(
        body: SafeArea(
          child: Center(
            child: Container(
              child: SfCartesianChart(
                annotations: <CartesianChartAnnotation>[
                  CartesianChartAnnotation(
                    widget: Container(
                      child: const Text('Text')
                    ),
                    // Coordinate unit type
                    coordinateUnit: CoordinateUnit.logicalPixel,
                    x: 150,
                    y: 200
                  )
                ]
              )
            )
          )
        )
      );
}![]()
Adding multiple annotation
You can add multiple annotations to the Chart by adding multiple widgets to the annotations property. as depicted in below code snippet.
@override
    Widget build(BuildContext context) {
      return Scaffold(
        body: SafeArea(
          child: Center(
            child: Container(
              child: SfCartesianChart(
                annotations: <CartesianChartAnnotation>[
               // first annotation
               CartesianChartAnnotation(
                  child: Container(child: const Text('High')),
                  coordinateUnit: CoordinateUnit.logicalPixel,
                  x: 90,
                  y: 200),
              // second annotation
              CartesianChartAnnotation(
                  child: Container(child: const Text('Low')),
                  coordinateUnit: CoordinateUnit.logicalPixel,
                  x: 170,
                  y: 200)
            ],
         )
       )
      )
    ),
  );
}![]()
Adding annotation for multiple axes
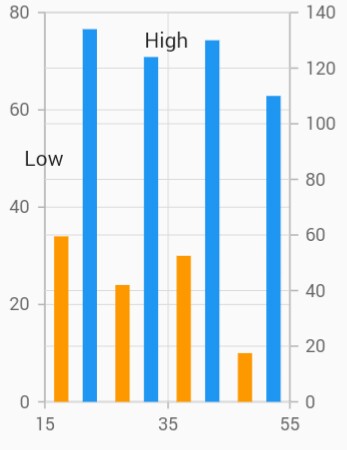
When there are multiple axes in the chart, annotation can be added for a particular axis by using the xAxisName and yAxisName properties. It is shown in the below code snippet.
@override
    Widget build(BuildContext context) {
      final List<ChartData> chartData = [
        ChartData(10, 17, 132),
        ChartData(20, 34, 134),
        ChartData(30, 24, 124),
        ChartData(40, 30, 130),
        ChartData(50, 10, 110)
      ];

      return Scaffold(
        body: SafeArea(
          child: Center(
            child: Container(
              child: SfCartesianChart(
                annotations: <CartesianChartAnnotation>[
                  CartesianChartAnnotation(
                    widget: Container(child: const Text('Low')),
                    coordinateUnit: CoordinateUnit.point,
                    x: 15,
                    y: 50
                  ),
                  CartesianChartAnnotation(
                    widget: Container(child: const Text('High')),
                    coordinateUnit: CoordinateUnit.point,
                    x: 35,
                    y: 130,
                    yAxisName: 'YAxis' // Refers to the additional axis
                  )
                ],
                primaryYAxis: NumericAxis(minimum: 0, maximum: 80),
                axes: <ChartAxis>[
                  NumericAxis(name: 'YAxis', opposedPosition: true)
                ],
                series: <CartesianSeries>[
                  ColumnSeries<ChartData, double>(
                    dataSource: chartData,
                    xValueMapper: (ChartData data, _) => data.x,
                    yValueMapper: (ChartData data, _) => data.y
                  ),
                  ColumnSeries<ChartData, double>(
                    dataSource: chartData,
                    xValueMapper: (ChartData data, _) => data.x,
                    yValueMapper: (ChartData data, _) => data.y2,
                    yAxisName: 'YAxis'
                  )
                ]
              )
            )
          )
        )
      );
    }

    class ChartData {
      ChartData(this.x, this.y, this.y2);
      final double x;
      final double y;
      final double y2;
    }
Chart with watermark
Chart supports watermark which allows you to mark the specific area of interest in the chart area. You can add the custom widgets and watermarks using this annotations feature as depicted below.
@override
    Widget build(BuildContext context) {
      return Scaffold(
        body: SafeArea(
          child: Center(
            child: Container(
              child: SfCartesianChart(
                annotations: <CartesianChartAnnotation>[
                 CartesianChartAnnotation(
                 child: Container(
                  child: const Text(
                    '€ - \$ ',
                  style: TextStyle(
                  color: Color.fromRGBO(216, 225, 227, 1),
                  fontWeight: FontWeight.bold,
                  fontSize: 80),
                    ),
                  ),
        coordinateUnit: CoordinateUnit.point,
        region: AnnotationRegion.chart,
        x: 3,
        y: 38,
                 )
                ]
              )
            )
          )
        )
      );
    }