Getting Started
9 Mar 201820 minutes to read
Before we start with the PivotChart, please refer this page for general information regarding integrating Syncfusion widget’s.
This section explains you the steps required to populate the PivotChart with data source. This section covers only the minimal features that you need to know to get started with the PivotChart.
Adding Script Reference
To render the PivotChart control, the following list of external dependencies are needed,
PivotChart uses one or more sub-controls, therefore refer the ej.web.all.min.js (which encapsulates all the ej controls and frameworks in a single file) in the application instead of referring all the above specified internal dependencies.
To get the real appearance of the PivotChart, the dependent CSS file ej.web.all.min.css (which includes styles of all the widgets) should also needs to be referred.
Refer this link to add the above dependencies in to your ember application.
Relational
This section covers the information that you need to know to populate a simple PivotChart with Relational data source.
Initialize PivotChart
The PivotChart component can be created with prefix of ej-.The code example for defining controls in EmberJS is as follows,
{{ej-pivotchart id="PivotChart"}}import Ember from 'ember';
export default Ember.Route.extend({
model(){
return {
}
},
});Populate PivotChart with relational data source
Let us now see how to populate the PivotChart control using a sample JSON data as shown below.
<div class="e-control">

	{{ej-pivotchart id="PivotChart" e-dataSource=model.dataSource e-isResponsive=model.isResponsive e-zooming=model.zooming e-type=model.type e-commonSeriesOptions=model.commonSeriesOptions e-size=model.size e-primaryYAxis=model.primaryYAxis e-legend=model.legend }}

</div>import Ember from 'ember';
export default Ember.Route.extend({
model(){
return {
dataSource: {
data: [
{ Amount: 100, Country: "Canada", Date: "FY 2005", Product: "Bike", Quantity: 2, State: "Alberta" },
{ Amount: 200, Country: "Canada", Date: "FY 2006", Product: "Van", Quantity: 3, State: "British Columbia" },
{ Amount: 300, Country: "Canada", Date: "FY 2007", Product: "Car", Quantity: 4, State: "Brunswick" },
{ Amount: 150, Country: "Canada", Date: "FY 2008", Product: "Bike", Quantity: 3, State: "Manitoba" },
{ Amount: 200, Country: "Canada", Date: "FY 2006", Product: "Car", Quantity: 4, State: "Ontario" },
{ Amount: 100, Country: "Canada", Date: "FY 2007", Product: "Van", Quantity: 1, State: "Quebec" },
{ Amount: 200, Country: "France", Date: "FY 2005", Product: "Bike", Quantity: 2, State: "Charente-Maritime" },
{ Amount: 250, Country: "France", Date: "FY 2006", Product: "Van", Quantity: 4, State: "Essonne" },
{ Amount: 300, Country: "France", Date: "FY 2007", Product: "Car", Quantity: 3, State: "Garonne (Haute)" },
{ Amount: 150, Country: "France", Date: "FY 2008", Product: "Van", Quantity: 2, State: "Gers" },
{ Amount: 200, Country: "Germany", Date: "FY 2006", Product: "Van", Quantity: 3, State: "Bayern" },
{ Amount: 250, Country: "Germany", Date: "FY 2007", Product: "Car", Quantity: 3, State: "Brandenburg" },
{ Amount: 150, Country: "Germany", Date: "FY 2008", Product: "Car", Quantity: 4, State: "Hamburg" },
{ Amount: 200, Country: "Germany", Date: "FY 2008", Product: "Bike", Quantity: 4, State: "Hessen" },
{ Amount: 150, Country: "Germany", Date: "FY 2007", Product: "Van", Quantity: 3, State: "Nordrhein-Westfalen" },
{ Amount: 100, Country: "Germany", Date: "FY 2005", Product: "Bike", Quantity: 2, State: "Saarland" },
{ Amount: 150, Country: "United Kingdom", Date: "FY 2008", Product: "Bike", Quantity: 5, State: "England" },
{ Amount: 250, Country: "United States", Date: "FY 2007", Product: "Car", Quantity: 4, State: "Alabama" },
{ Amount: 200, Country: "United States", Date: "FY 2005", Product: "Van", Quantity: 4, State: "California" },
{ Amount: 100, Country: "United States", Date: "FY 2006", Product: "Bike", Quantity: 2, State: "Colorado" },
{ Amount: 150, Country: "United States", Date: "FY 2008", Product: "Car", Quantity: 3, State: "New Mexico" },
{ Amount: 200, Country: "United States", Date: "FY 2005", Product: "Bike", Quantity: 4, State: "New York" },
{ Amount: 250, Country: "United States", Date: "FY 2008", Product: "Car", Quantity: 3, State: "North Carolina" },
{ Amount: 300, Country: "United States", Date: "FY 2007", Product: "Van", Quantity: 4, State: "South Carolina" }
],
rows: [
{
fieldName: "Country",
fieldCaption: "Country"
},
{
fieldName: "State",
fieldCaption: "State"
},
{
fieldName: "Date",
fieldCaption: "Date"
}
],
columns: [
{
fieldName: "Product",
fieldCaption: "Product"
}
],
values: [
{
fieldName: "Amount",
fieldCaption: "Amount"
}
]
},
isResponsive: true,
zooming : { enableScrollbar : true},
enableRTL: false,
type: ej.PivotChart.ChartTypes.Column,
commonSeriesOptions: {
enableAnimation: true,
type: ej.PivotChart.ChartTypes.Column, tooltip: { visible: true }
},
size: { height: "640px", width: "100%" },
primaryYAxis: { title: { text: "Amount" } },
legend: { visible: true }
}
}
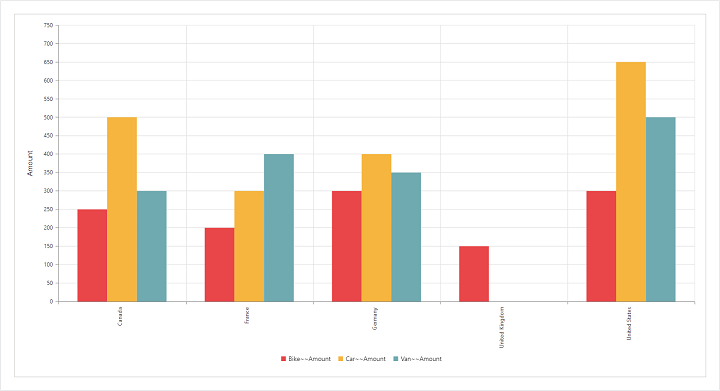
});The above code will generate a simple PivotChart with sales amount over products in different regions.
OLAP
This section covers the information that you need to know to populate a simple PivotChart with OLAP data source.
Initialize PivotChart
The PivotChart component can be created with prefix of ej-.The code example for defining controls in EmberJS is as follows,
{{ej-pivotchart id="PivotChart"}}import Ember from 'ember';
export default Ember.Route.extend({
model(){
return {
}
},
});Populate PivotChart with OLAP data source
Let us now see how to populate the PivotChart control using OLAP data source as shown below.
<div class="e-control">

	{{ej-pivotchart id="PivotChart" e-dataSource=model.dataSource e-isResponsive=model.isResponsive e-zooming=model.zooming e-type=model.type e-commonSeriesOptions=model.commonSeriesOptions e-size=model.size e-primaryXAxis=model.primaryXAxis e-primaryYAxis=model.primaryYAxis e-legend=model.legend }}

</div>import Ember from 'ember';
export default Ember.Route.extend({
model(){
return {
dataSource: {
data: "http://bi.syncfusion.com/olap/msmdpump.dll", //data
catalog: "Adventure Works DW 2008 SE",
cube: "Adventure Works",
rows: [
{
fieldName: "[Date].[Fiscal]"
}
],
columns: [
{
fieldName: "[Customer].[Customer Geography]"
}
],
values: [
{
measures: [
{
fieldName: "[Measures].[Internet Sales Amount]",
}
],
axis: "columns"
}
]
},
isResponsive: true,zooming : { enableScrollbar : true},
type: ej.PivotChart.ChartTypes.Column,
commonSeriesOptions: {
enableAnimation: true,
type: ej.PivotChart.ChartTypes.Column, tooltip: { visible: true }
},
size: { height: "560px", width: "100%" },
primaryXAxis: { title: { text: "Date - Fiscal" }, labelRotation: 0 },
primaryYAxis: { title: { text: "Internet Sales Amount" } },
legend: { visible: true, rowCount: 2 },
}
}
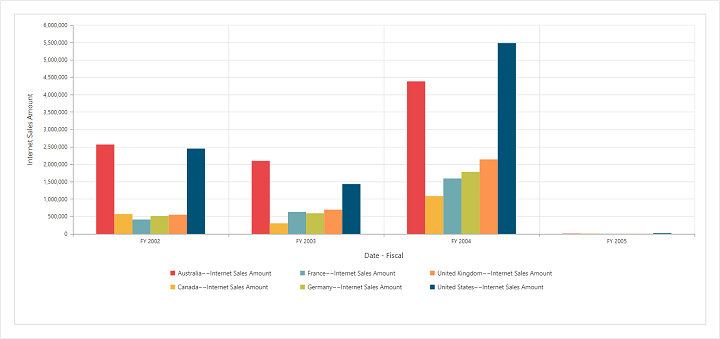
});The above code will generate a simple PivotChart with internet sales amount over a period of fiscal years across different customer geographic locations.