Getting Started
17 Nov 201724 minutes to read
Before we start with the Maps, please refer this page for general information regarding integrating Syncfusion widget’s.
Adding JavaScript and CSS Reference
To render the Maps control, the following list of external dependencies are needed,
- jsRender - to render the templates
The other required internal dependencies are tabulated below,
| Files | Description/Usage |
|---|---|
| ej.core.min.js | It is referred always before using all the JS controls. |
| ej.data.min.js | Used to handle data operation and is used while binding data to the JS controls. |
| ej.maps.min.js | Maps core script file which includes Maps related scripts files. |
Refer the ej.web.all.min.js which encapsulates all the ej controls and frameworks in a single file.
To get the real appearance of the Maps, the dependent CSS file ej.web.all.min.css (which includes styles of all the widgets) should also needs to be referred.
Control Initialization
-
Open the command prompt in the folder ember-app or the folder in which the application is created.
-
Use the command ember generate route map/defaultto create template
default.hbsfile in templates folder and routerdefault.jsfile in routes folder. It also add the routing content inrouter.js. -
Use below code in
default.hbsin templates folder to render the map.
- Use the below code in
default.jsin routes folder to bind the model to the map.
import Ember from 'ember';

    export default Ember.Route.extend({
      model() {
         return {
         }
      }
    });
Prepare Shape Data
The Shape Data collection describing geographical shape information can be obtained from GEOJSON format shapes.
In this example, USA shape is used as shape data by utilizing the “United States of America.json” file in the following folder structure obtained from downloaded Maps_GeoJSON folder.
..\ Maps_GeoJSON\All Countries with States
You can assign the complete contents in “United States of America.json” file to new JSON object. For your better understanding, a JS file “USA.js” is already created to store JSON data in JSON object “usMap”.
Prepare DataSource
The datasource is populated with JSON data relative to shape data and stored in JSON object. USA population as datasource is used for better understanding. The “populationData.js” file is used to store JSON data in JSON object “populationData”.
var populationData = [
        { name: 'California', population: '38332521' },
        { name: 'Texas', population: '26448193' },
        { name: 'New York', population: '19651127' },
        { name: 'Florida', population: '19552860' },
        { name: 'Illinois', population: '12882135' },
        { name: 'Pennsylvania', population: '12773801' },
        { name: 'Ohio', population: '11570808' },
        { name: 'Georgia', population: '9992167' },
        { name: 'Michigan', population: '9895622' },
        { name: 'North Carolina', population: '9848060' },
        { name: 'New Jersey', population: '8899339' },
        { name: 'Virginia', population: '8260405' },
        { name: 'Washington', population: '6971406' },
        { name: 'Massachusetts', population: '6692824' },
        { name: 'Arizona', population: '6626624' },
        { name: 'Indiana', population: '6570902' },
        { name: 'Tennessee', population: '6495978' },
        { name: 'Missouri', population: '6044171' },
        { name: 'Maryland', population: '5928814' },
        { name: 'Wisconsin', population: '5742713' },
        { name: 'Minnesota', population: '5420380' },
        { name: 'Colorado', population: '5268367' },
        { name: 'Alabama', population: '4833722' },
        { name: 'South Carolina', population: '4774839' },
        { name: 'Louisiana', population: '4625470' },
        { name: 'Kentucky', population: '4395295' },
        { name: 'Oregon', population: '3930065' },
        { name: 'Oklahoma', population: '3850568' },
        { name: 'Puerto Rico', population: '3615086' },
        { name: 'Connecticut', population: '3596080' },
        { name: 'Iowa', population: '3090416' },
        { name: 'Mississippi', population: '2991207' },
        { name: 'Arkansas', population: '2959373' },
        { name: 'Utah', population: '2900872' },
        { name: 'Kansas', population: '2893957' },
        { name: 'Nevada', population: '2790136' },
        { name: 'New Mexico', population: '2085287' },
        { name: 'Nebraska', population: '1868516' },
        { name: 'West Virginia', population: '1854304' },
        { name: 'Idaho', population: '1612136' },
        { name: 'Hawaii', population: '1404054' },
        { name: 'Maine', population: '1328302' },
        { name: 'New Hampshire', population: '1323459' },
        { name: 'Rhode Island', population: '1051511' },
        { name: 'Montana', population: '1015165' },
        { name: 'Delaware', population: '925749' },
        { name: 'South Dakota', population: '844877' },
        { name: 'Alaska', population: '735132' },
        { name: 'North Dakota', population: '723393' },
        { name: 'District of Columbia', population: '646449' },
        { name: 'Vermont', population: '626630' },
        { name: 'Wyoming', population: '582658' }
       ];
Refer to both shape data and datasource as illustrated in the following code example in index.html file.
<script src="scripts/USA.js" type="text/javascript"></script>
   <script src="scripts/populationData.js" type="text/javascript"></script>
Initialize Map
1. Create a <div> tag with a specific id and set the height and width to determine the rendering map’s size with ej-map attribute.
2. Set the shapeData attribute value as usMap under layer property, which contains the USA shape data details.
- Now create a document with .js extension under
app/routes/mapfolder with the below code snippet.
import Ember from 'ember';

    export default Ember.Route.extend({
      model() {
         return {
             layers: [
                {
                    layerType: "geometry",
                    shapeData: usMap
                }
            ]
         }
      }
    });
Running the application
- To run the application, execute below command.
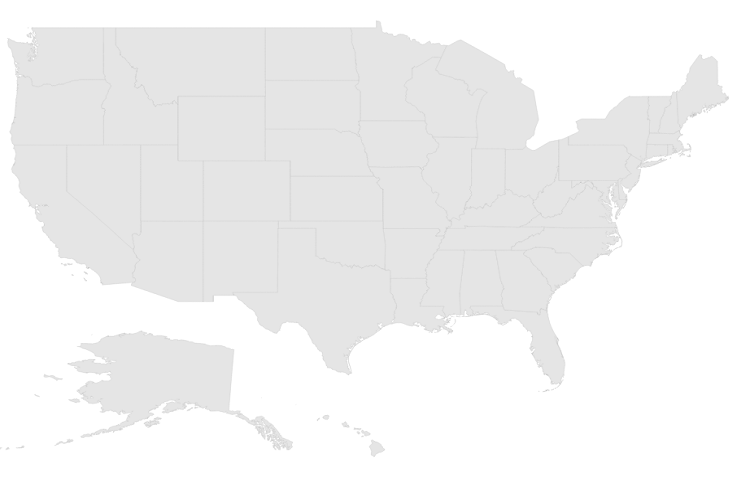
ember serve- Browse to http://localhost:4200 to see the application. And navigate to map sample. The component is rendered as like the below screenshot. You can make changes in the code found under app folder and the browser should auto-refresh itself while you save files.
The above code renders a map, with default properties and shape input provided through data in layers.
Data Binding in Map
The following properties in shape layers are used for binding data in Map control.
- dataSource
- shapeDataPath
- shapePropertyPath
DataSource
The dataSource property accepts collection values as input. For example, the list of objects can be provided as input.
Shape Data Path
The shapeDataPath property used to refer the data ID in dataSource. For example, “populationData” JSON object contains data ids ‘name’ and ‘population’. The shapeDataPath and the shapePropertyPath properties are related to each other (refer to shapePropertyPath for more details).
Shape Property Path
The shapePropertyPath property is similar to the shapeDataPath that refers the column name in the shapeData property of shape layers to identify the shape. When the values of the shapeDataPath property in the dataSource property and the value of shapePropertyPath in the shapeData property match, then the associated object from the dataSource is bound to the corresponding shape.
The JSON object “populationData” is used as dataSource in the following code example.
export default Ember.Route.extend({
      model() {
         return {
             layers: [
                {
                    shapeData: usMap,
                    shapeDataPath: "name",
                    shapePropertyPath: "name",
                    dataSource: populationData
                }
            ]
         }
      }
    });
Customize Map Appearance
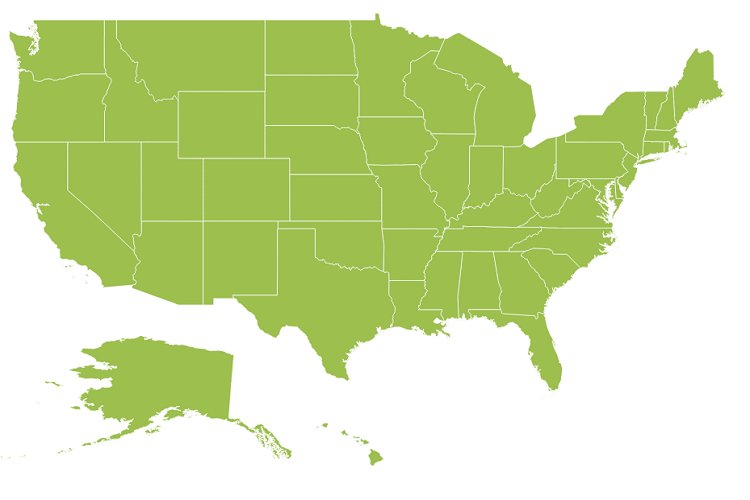
You can customize the shape’s color by using fill, stroke and strokeThickness properties in shapeSettings.
export default Ember.Route.extend({
      model() {
         return {
             layers: [
                {
                    shapeData: usMap,
                    shapeDataPath: "name",
                    shapePropertyPath: "name",
                    dataSource: populationData,
                    enableSelection: false,
                    enableMouseHover: true,
                    shapeSettings: {
                        fill: "#9CBF4E",
                        strokeThickness: "0.5",
                        stroke: "White",
                        highlightStroke: "White",
                        highlightColor: "#BC5353",
                        highlightBorderWidth: "1"
                    }
                }
            ]
         }
      }
    });
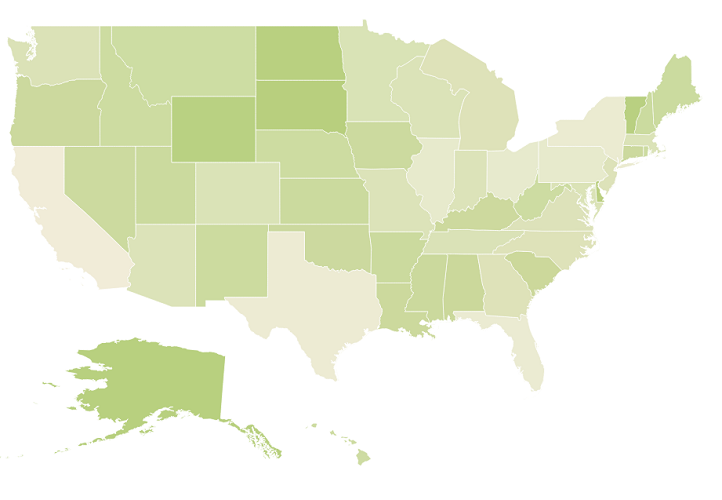
Customize Map Appearance by Range
The Range color mapping is used to differentiate the shape’s fill based on its underlying value and color ranges. The from and to properties defines the value ranges and the gradientColors property defines the equivalent color ranges respective to their value ranges.
NOTE
The
enableGradientproperty value is set to true to apply gradient colors for the maps.
export default Ember.Route.extend({
      model() {
         return {
             layers: [
                {
                    shapeData: usMap,
                    shapeDataPath: "name",
                    shapePropertyPath: "name",
                    dataSource: populationData,
                    enableSelection: false,
                    enableMouseHover: true,
                    shapeSettings: {
                        fill: "#9CBF4E",
                        strokeThickness: "0.5",
                        stroke: "White",
                        highlightStroke: "White",
                        highlightColor: "#BC5353",
                        highlightBorderWidth: "1",
                        valuePath: "name",
                        colorValuePath: "population",
                        enableGradient: true,
                        colorMappings:
                        {
                            rangeColorMapping: [
                                {
                                    from: 500000,
                                    to: 1000000,
                                    gradientColors: ["#9CBF4E", "#B8CE7B"]
                                },
                                {
                                    from: 1000001,
                                    to: 5000000,
                                    gradientColors: ["#B8CE7B", "#CBD89A"]
                                },
                                {
                                    from: 5000001,
                                    to: 10000000,
                                    gradientColors: ["#CBD89A", "#DEE2B9"]
                                },
                                {
                                    from: 10000001,
                                    to: 40000000,
                                    gradientColors: ["#DEE2B9", "#F1ECD8"]
                                }
                            ]
                        }
                    }
                }
            ]
         }
      }
    });
Enable Tooltip
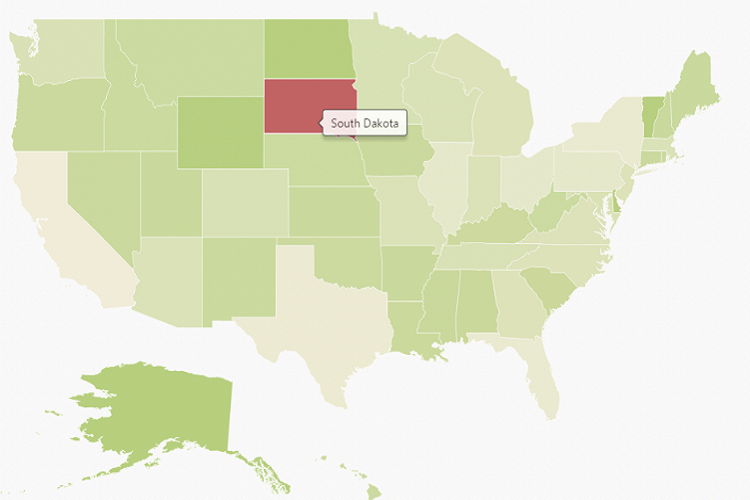
The tooltip is displayed only when the showTooltip is set to “True” in the layers. By default, it takes the property of the bound object that is referred in the valuePath and displays its content on hovering the corresponding shape. The tooltipTemplate property is used for customizing the template for tooltip.
export default Ember.Route.extend({
      model() {
         return {
             layers: [
                {
                    // ...
                    shapeSettings: {
                        // ...
                        valuePath: "name",
                        // ...
                    },
                    showTooltip: true
                }
            ]
         }
      }
    });
The following screenshot illustrates a map control displaying a Tooltip.
Legend
A Legend can be made visible by setting the showLegend property in legendSettings.
Interactive Legend
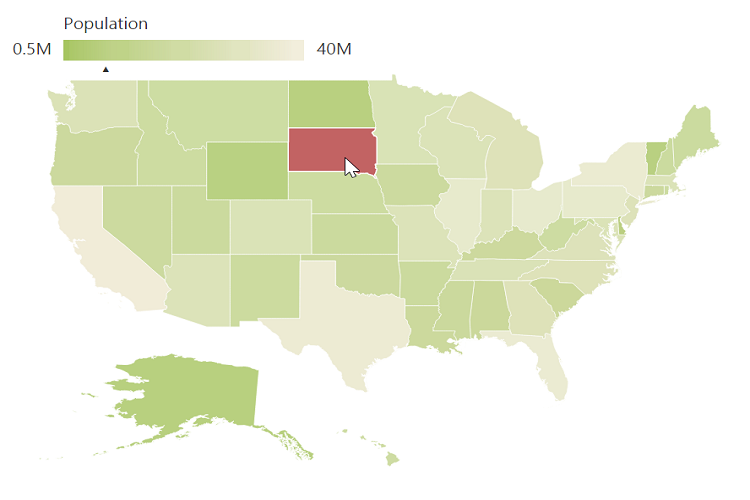
The legends can be made interactive with an arrow mark indicating the exact range color in the legend, when the mouse hovers on the corresponding shape. You can enable this option by setting the mode property in the legendSettings value as “interactive”. The default value of mode property is “default” to enable the normal legend.
Title
Use the title property to provide title for interactive legend.
Label
You can use leftLabel and rightLabel property to provide left and right labels for interactive legend.
export default Ember.Route.extend({
      model() {
         return {
             layers: [
                {
                    // ...
                    legendSettings: {
                        showLegend:true,
						dockOnMap:true,
                        height:18,
                        width:190,
                        mode:"interactive",
                        title: "Population",
                        leftLabel: "0.5M",
                        rightLabel: "40M"
                    }
                }
            ]
         }
      }
    });
The following screenshot illustrates a map displaying an interactive legend.