#Getting Started
Before we start with the LinearGauge, please refer this page for general information regarding integrating Syncfusion widget’s.
Adding JavaScript and CSS Reference
To render the LinearGauge control, the following list of external dependencies are needed,
- jsRender - to render the templates
The other required internal dependencies are tabulated below,
| Files | Description/Usage |
|---|---|
| ej.core.min.js | It is referred always before using all the JS controls. |
| ej.data.min.js | Used to handle data operation and is used while binding data to the JS controls. |
| ej.lineargauge.min.js | LinearGauge core script file which includes LinearGauge related scripts files. |
| excanvas.min.js |
Refer the ej.web.all.min.js which encapsulates all the ej controls and frameworks in a single file.
Control Initialization
-
Open the command prompt in the folder ember-app or the folder in which the application is created.
-
Use the command ember generate route lineargauge/defaultto create template
default.hbsfile in templates folder and routerdefault.jsfile in routes folder. It also add the routing content inrouter.js. -
Use below code in
default.hbsin templates folder to render the lineargauge.
- Use the below code in
default.jsin routes folder to bind the model to the lineargauge.
import Ember from 'ember';

    export default Ember.Route.extend({
      model() {
         return {
         }
      }
    });
Running the application
- To run the application, execute below command.
ember serve- Browse to http://localhost:4200 to see the application. And navigate to lineargauge sample. The component is rendered as like the below screenshot. You can make changes in the code found under app folder and the browser should auto-refresh itself while you save files.
Set Height and Width values
-
Basic attributes of each canvas elements are height and width properties.
-
You can set the height and width of the gauge as shown in the following code example.
import Ember from 'ember';

    export default Ember.Route.extend({
      model() {
         return {
             height: 550,
             width: 500,
         }
      }
    });
On executing the above code sample renders a default Linear Gauge with height and width.
Set animate option and Label Color
-
You can draw the Thermometer with Label color and set animate property to True.
-
Initially set the animate property to False to avoid unwanted script loads.
import Ember from 'ember';

    export default Ember.Route.extend({
      model() {
         return {
             height: 550,
             width: 500,
             labelColor: "#8c8c8c",
             enableAnimation: false,
         }
      }
    });
On executing the above code sample renders a customized Linear Gauge as follows.
Provide scale values
-
You can change the Scale Style of Thermometer using type property.
-
You can set the Minimum temperature up to -10 and maximum body temperature up to 110.
-
You can set the Minimum scale value as -10 and maximum value as 110.
-
You can set the Location values such as vertical and horizontal position in the thermometer.
-
You can set the thermometer height using length property.
-
You can set the Minor Interval value as 5 to get the exact temperature of the patient.
import Ember from 'ember';

    export default Ember.Route.extend({
      model() {
         return {
            height: 550,
            width: 500,
            enableAnimation: false,
            scales: [{
                type: "thermometer",
                backgroundColor: "transparent",
                minimum: -10,
                maximum: 110,
                minorIntervalValue: 5,
                width: 20,
                position: { x: 50, y: 18 },
                length: 355,
                border: { width: 0.5 }
                //Add the pointers customization code here
                //Add the labels customization code here
                //Add the ticks customization code here
                //Add the Custom labels customization code here
            }]
         }
      }
    });
On executing the above code sample renders a customized gauge with ranges as follows.
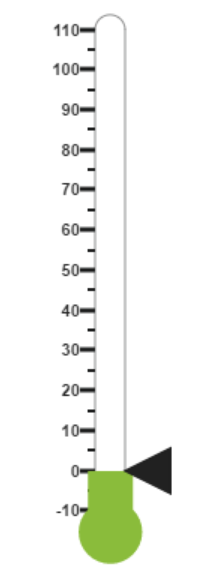
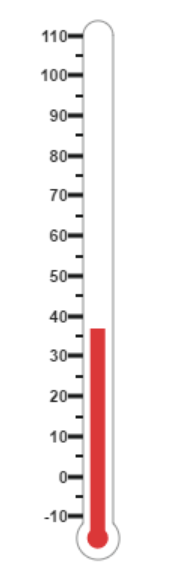
Add pointers data
In Linear gauge there are two types of pointers available such as marker pointer and bar pointer.
-
Marker pointer displays as a pointer device which shows the actual values. In this example, there is no need to show a marker pointer in a thermometer, therefore, you can hide it by setting the Opacity property to ‘0’.
-
Bar pointer displays as a mercury metal that shows the exact temperature of the person. You can set the basic properties of the bar pointer such as width, distanceFromScale, Value and backgroundColor.
import Ember from 'ember';

    export default Ember.Route.extend({
      model() {
         return {
            height: 550,
            width: 500,
            enableAnimation: false,
            scales: [{
                //Add the pointers customization code here
                markerPointers: [{ opacity: 0 }],
                barPointers: [{
                    width: 10,
                    distanceFromScale: -0.5,
                    value: 37,
                    backgroundColor: "#DB3738"
                }],
                //Add the labels customization code here
                //Add the ticks customization code here
                //Add the Custom labels customization code here
            }]
         }
      }
    });
On executing the above code sample renders a Linear Gauge with bar marker as follows.
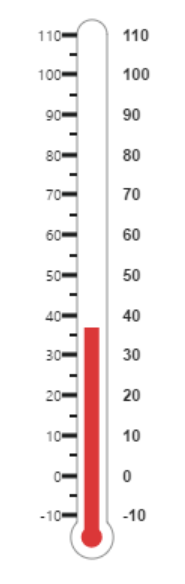
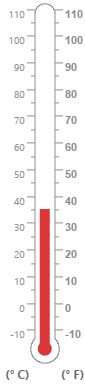
Add Label Customization
-
You can display the label value on both sides to get temperature in different scales. For that you can add two label values in an array.
-
You can use the scale labels to display the value in the gauge. You can customize the label placement, font (including its style and family) and its distance from scale.
import Ember from 'ember';

    export default Ember.Route.extend({
      model() {
         return {
            height: 550,
            width: 500,
            enableAnimation: false,
            scales: [{
                //Add the pointers customization code here
                //Add the labels customization code here
                labels: [{
                    placement: "near",
                    font: {
                        size: "10px", fontFamily: "Segoe UI",
                        fontStyle: "Normal"
                    }
                },
                {
                    placement: "far",
                    distanceFromScale: { x: 10 }
                }],
                //Add the ticks customization code here
                //Add the Custom labels customization code here
            }]
         }
      }
    });
On executing the above code sample renders a customized Linear Gauge as follows.
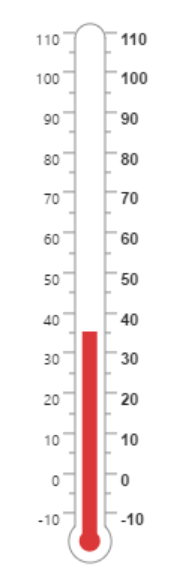
Add Ticks Details
-
You can set the width and height of the major ticks greater than the Minor ticks. You can set dark background for tick Color to have a better visibility.
-
You can also use four ticks for both the sides, each having two minor ticks and major ticks.
import Ember from 'ember';

    export default Ember.Route.extend({
      model() {
         return {
            height: 550,
            width: 500,
            enableAnimation: false,
            scales: [{
                //Add the pointers customization code here
                //Add the labels customization code here
                //Add the ticks customization code here
                ticks: [{
                    type: "majorinterval",
                    height: 8,
                    width: 1,
                    color: "#8c8c8c",
                    distanceFromScale: { y: -4 }
                }, {
                    type: "minorinterval",
                    height: 4,
                    width: 1,
                    color: "#8c8c8c",
                    distanceFromScale: { y: -4 }
                }, {
                    type: "majorinterval",
                    placement: "far",
                    height: 8,
                    width: 1,
                    color: "#8c8c8c",
                    distanceFromScale: { y: -4 }
                }, {
                    type: "minorinterval",
                    placement: "far",
                    height: 4,
                    width: 1,
                    color: "#8c8c8c",
                    distanceFromScale: { y: -4 }
                }],
                //Add the Custom labels customization code here
            }]
         }
      }
    });
On executing the above code sample renders a Linear Gauge with custom labels as follows.
Add Custom Label Details
-
You can specify the texts using Custom labels which displays in the gauge and customize them using various properties.
-
You can change the showIndicators property as True to show the custom labels.
The following code example illustrates how to use custom texts.
import Ember from 'ember';

    export default Ember.Route.extend({
      model() {
         return {
            height: 550,
            width: 500,
            enableAnimation: false,
            scales: [{
                showCustomLabels: true,
                //Add the pointers customization code here
                //Add the labels customization code here
                //Add the ticks customization code here
                //Add the Custom labels customization code here
                customLabels: [{
                    value: "(° C)",
                    position: { x: 44, y: 78 },
                    font: "Bold 12px Segoe UI", color: "#666666"
                }, {
                    value: "(° F)",
                    position: { x: 56, y: 78 },
                    font: "Bold 12px Segoe UI", color: "#666666"
                },
                {
                    position: { x: 51, y: 90 },
                    font: "Bold 13px Segoe UI",
                    color: "#666666"
                }]
            }]
         }
      }
    });
On executing the above code sample renders a customized Linear Gauge as follows.
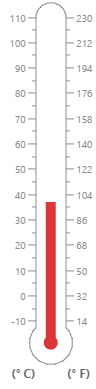
Change scale Degree to Fahrenheit
You can add a function to convert the temperature from Degrees to Fahrenheit values in the label by having index value as 1.
import Ember from 'ember';
export default Ember.Route.extend({
model() {
return {
drawLabels: function(args) {
if (args.label.index == 1) {
args.style.textValue = (args.label.value * (9 / 5)) + 32;
args.style.font = "Normal 10px Segoe UI";
}
},
}
}
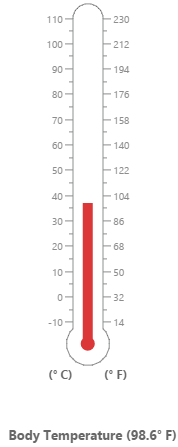
});On executing the above code sample renders a Linear Gauge with values in Degrees and Fahrenheit as follows.
Add Custom label for Current Value
You can add the function that displays the current temperature value in the custom label.
import Ember from 'ember';

    export default Ember.Route.extend({
      model() {
         return {
           drawLabels: function(args) {
				 if (args.label.index == 1) {
				 args.style.textValue = (args.label.value * (9 / 5)) + 32;
				 args.style.font = "Normal 10px Segoe UI";
				 }
			},
            drawCustomLabel: function(args) {
				if (args.customLabelIndex == 2) {
					var temp = args.scaleElement.barPointers[0].value;
					var fahValue = (temp * (9 / 5)) + 32;
					if (temp == -10) {
						args.style.textValue = "Very Cold Weather" + "(" + fahValue.toFixed(1) + "° F)";
					}
					else if ((temp > -10 && temp < 0) || (temp > 0 && temp < 15)) {
						args.style.textValue = "Cool Weather" + " (" + fahValue.toFixed(1) + "° F)";
					}
					else if (temp == 0) {
						args.style.textValue = "Freezing point of Water" + " (" + fahValue.toFixed(1) + "° F)";
					}
					else if (temp >= 15 && temp < 30) {
						args.style.textValue = "Room Temperature" + " (" + fahValue.toFixed(1) + "° F)";
					}
					else if (temp == 30) {
						args.style.textValue = "Beach Weather" + " (" + fahValue.toFixed(1) + "° F)";
					}
					else if (temp == 37) {
						args.style.textValue = "Body Temperature" + " (" + fahValue.toFixed(1) + "° F)";
					}
					else if (temp == 40) {
						args.style.textValue = "Hot Bath Temperature" + " (" + fahValue.toFixed(1) + "° F)";
					}
					else if (temp > 40 && temp < 100) {
						args.style.textValue = "Very Hot Temperature" + " (" + fahValue.toFixed(1) + "° F)";
					}
					else if (temp == 100) {
						args.style.textValue = "Boiling point of Water" + " (" + fahValue.toFixed(1) + "° F)";
					}
				}
			},
         }
      }
    });
The following screen shot displays a linear gauge with all the customizations discussed earlier.