Connecting MySQL Server to Syncfusion® Vue Diagram using LINQ2DB
18 Nov 201822 minutes to read
This guide explains how to load and visualize organizational chart data stored in a MySQL database using the Vue Diagram component. It demonstrates how to configure MySQL, create the required database schema, expose the data through an ASP.NET Core Web API, and bind the API response to a Vue application to render an organizational chart.
What is LINQ2DB?
LINQ2DB is a lightweight object-relational mapping (ORM) library for .NET that simplifies database access. It enables applications to query relational databases such as MySQL using LINQ syntax, providing a type-safe and efficient way to retrieve data without the overhead of larger ORM frameworks.
Key benefits of LINQ2DB:
- Lightweight Performance: Provides efficient database access with minimal runtime overhead.
- LINQ Support: Use familiar LINQ syntax for database queries instead of raw SQL strings.
- Type Safety: Strong typing reduces runtime errors and provides IntelliSense support.
- Built-in Security: Automatic parameterization prevents SQL injection attacks.
- MySQL-Specific: Supports modern MySQL versions, including MySQL 8.0, with proper handling of character encoding and collation.
- Minimal Configuration: Simple setup with straightforward connection string management.
Prerequisites
Ensure the following software and packages are installed before proceeding:
| Software/Package | Version | Purpose |
|---|---|---|
| Visual Studio | 17.0 or later | Development IDE |
| .NET SDK | 8.0 or compatible | Runtime and build tools |
| MySQL Server | 8.0.46 | Database server |
| MySQL Workbench | Latest stable | GUI client for MySQL management |
| Node.js | v20.x or later | JavaScript runtime for Vue |
| npm | Latest | Package manager for Vue dependencies |
Installing and configuring MySQL Server and Workbench
To store and manage diagram data, MySQL Server must be installed and configured before connecting it to the ASP.NET Core Web API. This section describes how to install MySQL Server and MySQL Workbench, and how to verify connectivity to the database server.
Installing MySQL Server
MySQL Server provides the relational database engine used to store organizational chart data required by the diagram component.
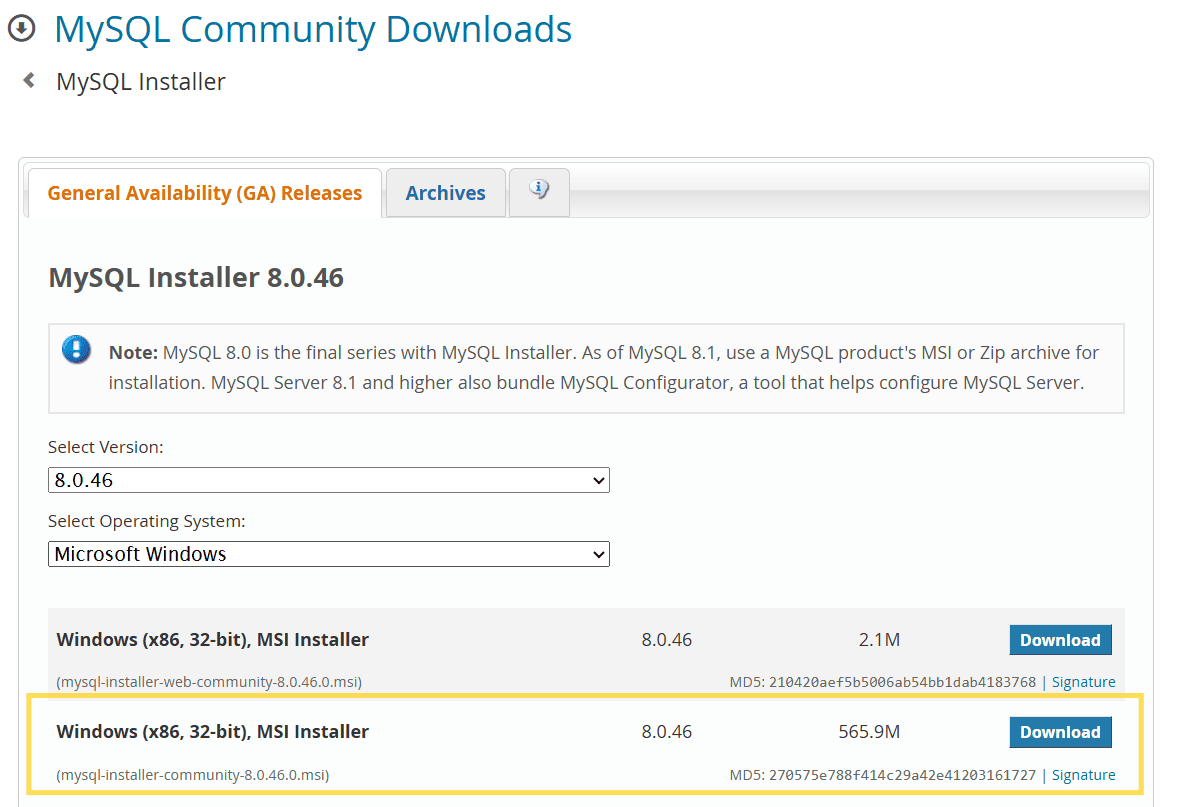
- Download MySQL Installer version 8.0.46 from mysql.com.
- Run the installer and follow the setup wizard.
- Choose setup type as Server only.
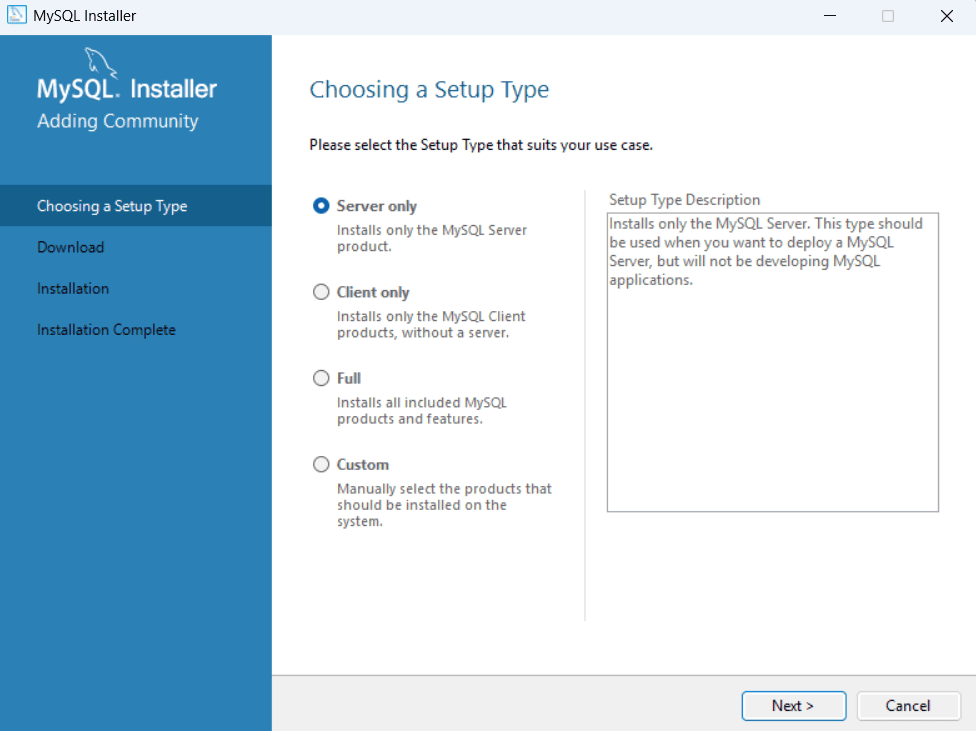
- Next, Download and Install the MySQL Server 8.0.46.
- Choose setup type as Server only.
- Configure the MySQL Server after installation.
- Choose server configuration type as Development Computer.
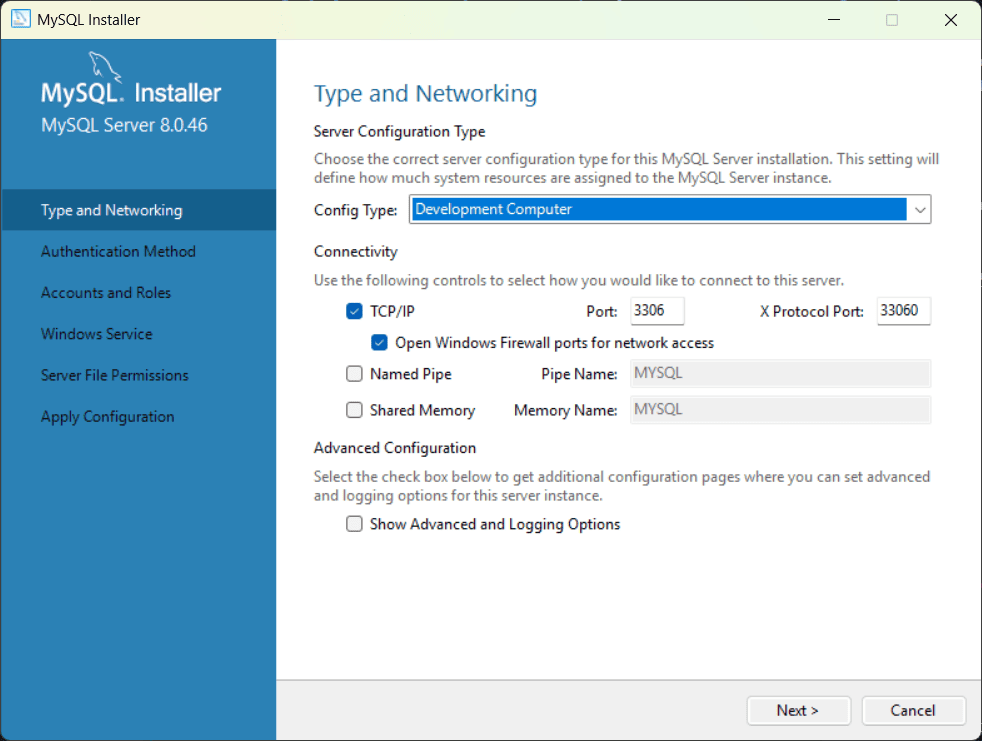
- Choose Strong Password Encryption for Authentication and set your root account password.
- Specify a Windows service name (e.g., MySQL80).
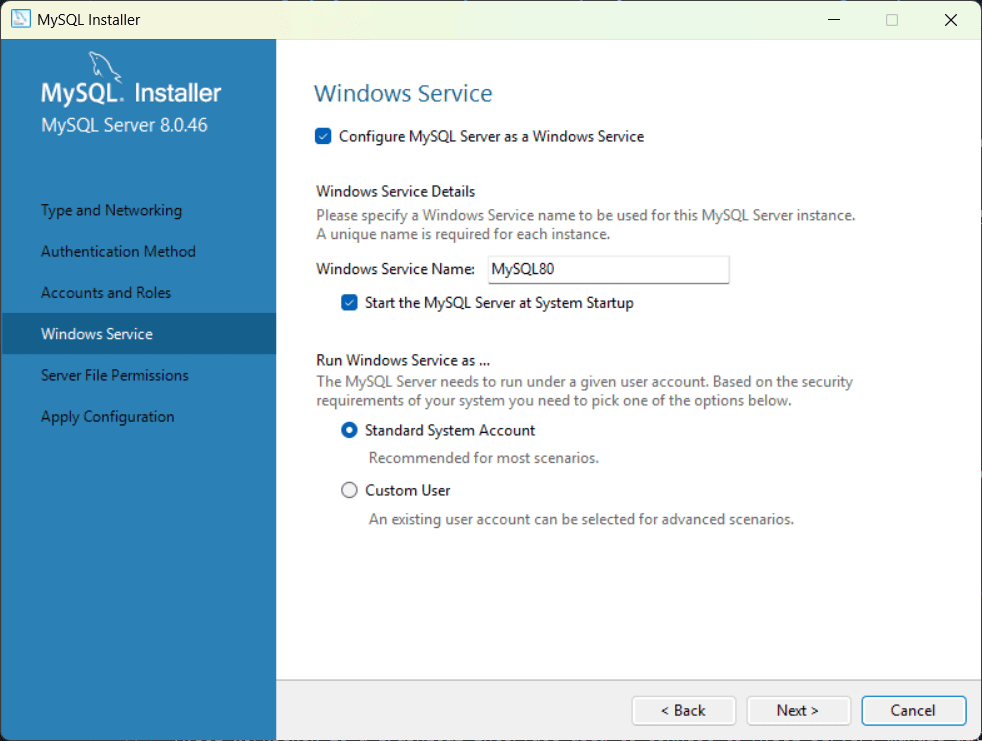
- Start applying the configuration by clicking the Execute button.
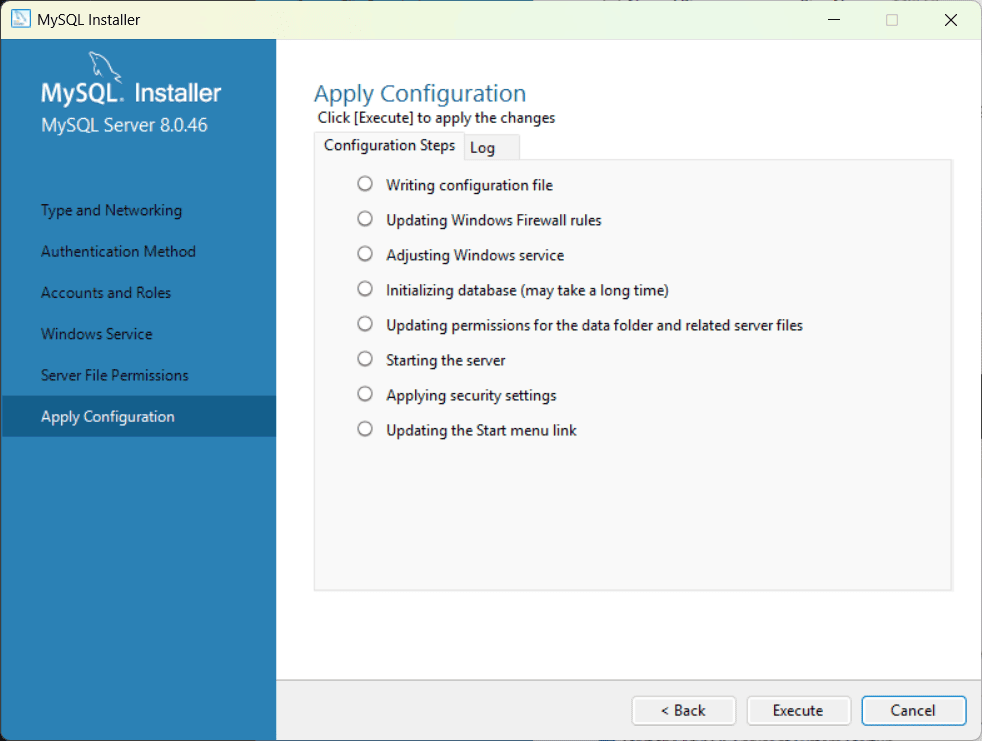
- Choose server configuration type as Development Computer.
- Click Finish to complete the installation.
Installing MySQL Workbench
MySQL Workbench is a graphical tool used to connect to MySQL Server, manage databases, execute SQL queries, and inspect data.
- Download MySQL Workbench Installer version 8.0.47 from mysql-workbench
- Run the installer and follow the setup wizard.
- Choose the setup type as Complete.
- Click Finish after installing MySQL Workbench.
Connecting to MySQL Server using MySQL Workbench
After installing MySQL Workbench, create a connection to the MySQL Server instance to begin creating databases and tables.
- Launch MySQL Workbench.
- Click + to create a new connection.
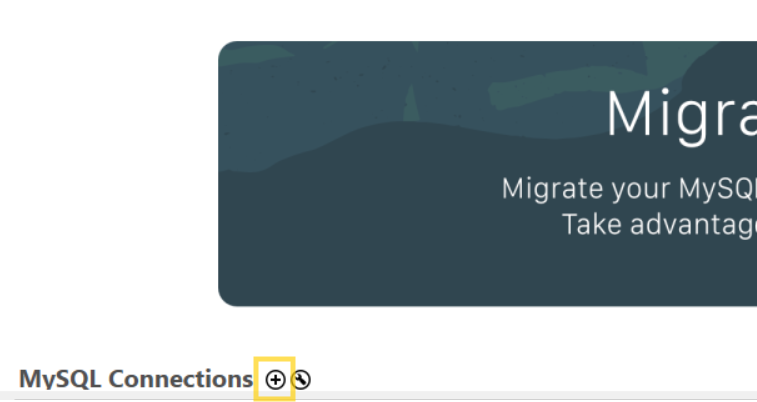
- Configure the connection settings:
- Connection Name: Local MySQL
- Hostname: localhost
- Port: 3306
- Username: root
- Password: (your MySQL root password)
- Click Test Connection to verify the connection.
- Click OK to save the connection.
The MySQL Server instance is now connected and ready for database creation.
Creating the database and table
The database required for the application can be created using one of the following methods:
- Using MySQL Workbench
- Using the MySQL Command Line Client
Creating a database using MySQL Workbench
Use MySQL Workbench to create the required database and table for storing organizational chart data.
- Open MySQL Workbench.
- On the home screen, click your MySQL connection (for example: Local MySQL).
- The SQL Editor opens. This editor is used to write and execute SQL statements for the selected connection.
- Paste the following SQL script into the SQL Editor:
-- Create database with UTF-8 support
CREATE DATABASE IF NOT EXISTS diagramdb
  CHARACTER SET utf8mb4
  COLLATE utf8mb4_general_ci;

-- Select the database
USE diagramdb;

-- Create employees table
CREATE TABLE IF NOT EXISTS employees (
  Id               INT NOT NULL AUTO_INCREMENT PRIMARY KEY,
  Name             VARCHAR(100) NOT NULL,
  ParentId         INT NULL,
  FOREIGN KEY (ParentId) REFERENCES employees(Id) ON DELETE SET NULL
) ENGINE=InnoDB DEFAULT CHARSET=utf8mb4 COLLATE=utf8mb4_general_ci;

-- Insert sample organizational hierarchy data
INSERT INTO employees (Name, ParentId)
VALUES
('CEO', NULL),
('VP Engineering', 1),
('VP Sales', 1),
('Engineering Lead', 2),
('Sales Manager', 3),
('Developer 1', 4),
('Developer 2', 4),
('Sales Rep 1', 5),
('Sales Rep 2', 5);
- Click the Execute button (or press Ctrl + Shift + Enter) to run the script.
- The Output window at the bottom displays status messages and any errors related to the SQL actions.
Verify the database and table:
To confirm that the database and table were created successfully:
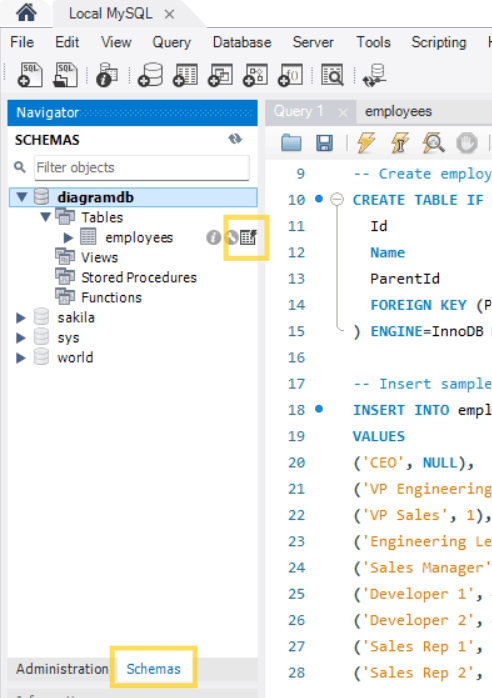
- In the Navigator → SCHEMAS panel on the left side, click the Refresh icon.
- Expand: diagramdb - Tables - employees.
- Click the Output Grid icon to view the table data in grid view.
Creating a database via MySQL Command Line Client
The database can also be created using the MySQL Command Line Client.
- Open MySQL Command Line Client.
- Enter your MySQL root password when prompted.
- Paste the same SQL script used in MySQL Workbench and press Enter.
- Run the query SELECT * FROM employees; to verify the inserted data.
Expected output:
| Id | Name | ParentId |
|---|---|---|
| 1 | CEO | NULL |
| 2 | VP Engineering | 1 |
| 3 | VP Sales | 1 |
| 4 | Engineering Lead | 2 |
| 5 | Sales Manager | 3 |
| 6 | Developer 1 | 4 |
| 7 | Developer 2 | 4 |
| 8 | Sales Rep 1 | 5 |
| 9 | Sales Rep 2 | 5 |
Integrating MySQL Server with ASP.NET Core Web API
This section explains how to create an ASP.NET Core Web API project that connects to MySQL and exposes data for use by the Vue Diagram component.
Creating the Web API project using Visual Studio
- Open Visual Studio.
- Click Create a new project.
- Search for “ASP.NET Core Web API” and select it.
- Click Next.
- Configure project settings:
- Project name: Diagram_MySQL.Server
- Location: Choose a folder
- Solution name: Diagram_MySQL
- Click Next.
- Additional information:
- Framework: .NET 8.0 (or latest available)
- Authentication type: None
- Uncheck: “Configure for HTTPS”
- Click Create.
Visual Studio creates a new ASP.NET Core Web API project with default files such as Program.cs, Controllers, and appsettings.json.
Creating the Web API project using Visual Studio Code
Alternatively, the project can be created using the .NET CLI, which is commonly used with Visual Studio Code.
- Open a terminal or command prompt.
- Navigate to the directory where the server application should be created.
- Run the following commands:
dotnet new webapi -n Diagram_MySQL.Server
cd Diagram_MySQL.Server
Installing NuGet packages using Package Manager Console
The Web API requires additional NuGet packages for LINQ2DB, MySQL connectivity, and JSON serialization.
Method 1: Using Package Manager Console (Visual Studio)
- In Visual Studio, go to Tools → NuGet Package Manager → Package Manager Console.
- Run the following commands sequentially:
Install-Package linq2db -Version 6.1.0
Install-Package linq2db.MySql -Version 6.1.0
Install-Package linq2db.AspNet -Version 5.4.1.9
Install-Package MySqlConnector -Version 2.5.0
Install-Package Microsoft.AspNetCore.Mvc.NewtonsoftJson -Version 8.0.0
Method 2: Using .NET CLI / Integrated Terminal (Visual Studio Code)
Alternatively, the packages can be installed using the .NET CLI from the project directory.
dotnet add package linq2db --version 6.1.0
dotnet add package linq2db.MySql --version 6.1.0
dotnet add package linq2db.AspNet --version 5.4.1.9
dotnet add package MySqlConnector --version 2.5.0
dotnet add package Microsoft.AspNetCore.Mvc.NewtonsoftJson --version 8.0.0
Create the data model
A data model represents a database table as a C# class and maps table columns to class properties.
Instructions:
- Create a new folder named Models in the Diagram_MySQL.Server project.
- Inside the Models folder, create a new file named Employee.cs.
- Define the
Employeeclass with the following code:
using LinqToDB.Mapping;

namespace Diagram_MySQL.Server.Models
{
    [Table("employees")]
    public class Employee
    {
        [PrimaryKey, Identity]
        [Column("Id")]
        public int Id { get; set; }

        [Column("Name")]
        [NotNull]
        public string Name { get; set; }

        [Column("ParentId")]
        public int? ParentId { get; set; }
    }
}
Configuring the connection string
The connection string defines how the application connects to the MySQL server.
Instructions:
- Open appsettings.json.
- Add or update the
ConnectionStringssection with the MySQL connection details:
{
  "ConnectionStrings": {
    "MySqlConn": "Server=localhost;Port=3306;Database=diagramdb;User Id=root;Password=YOUR_PASSWORD_HERE;"
  },
  "Logging": {
    "LogLevel": {
      "Default": "Information",
      "Microsoft.AspNetCore": "Warning"
    }
  },
  "AllowedHosts": "*"
}
Configuring the LINQ2DB data connection
A data connection class is required for LINQ2DB to communicate with MySQL.
Instructions:
- Create a new folder named Data in the Diagram_MySQL.Server project.
- Inside the Data folder, create a new file named AppDataConnection.cs.
- Define the
AppDataConnectionclass with the following code:
using Diagram_MySQL.Server.Models;
using LinqToDB;
using LinqToDB.Data;
using LinqToDB.DataProvider.MySql;

namespace Diagram_MySQL.Server.Data
{
    public sealed class AppDataConnection : DataConnection
    {
        public AppDataConnection(IConfiguration config)
            : base(new DataOptions().UseMySql(
                config.GetConnectionString("MySqlConn"),
                MySqlVersion.MySql80,
                MySqlProvider.MySqlConnector))
        {
            InlineParameters = true;
        }

        public ITable<Employee> Employees => this.GetTable<Employee>();
    }
}
Creating the Diagram API controller
The API controller retrieves employee records and exposes them as an HTTP endpoint.
Instructions:
- Create a new folder named Controllers (if not exist) in the Diagram_MySQL.Server project.
- Inside the Controllers folder, create a new file named DiagramController.cs.
- Add the following code:
using Diagram_MySQL.Server.Data;
using Diagram_MySQL.Server.Models;
using LinqToDB;
using LinqToDB.Async;
using Microsoft.AspNetCore.Mvc;

namespace Diagram_MySQL.Server.Controllers
{
    [ApiController]
    [Route("api/[controller]")]
    public class DiagramController : ControllerBase
    {
        private readonly AppDataConnection _db;
        public DiagramController(AppDataConnection db) => _db = db;

        [HttpGet("items")]
        public async Task<IActionResult> GetItems()
        {
            var items = await _db.Employees.ToListAsync();
            return Ok(items);
        }
    }
}
Registering services in Program.cs
The Program.cs file is where we configure all backend services and middle ware.
Instructions:
- Open Program.cs in the project root.
- Add the following code.
using Diagram_MySQL.Server.Data;
using LinqToDB;
using LinqToDB.AspNet;
using LinqToDB.DataProvider.MySql;

var builder = WebApplication.CreateBuilder(args);

// Add services to the container.

builder.Services.AddControllers().AddNewtonsoftJson();

// Configure CORS (Cross-Origin Resource Sharing) for development
// IMPORTANT: This allows the Vue frontend (http://localhost:5173) to make requests to this backend (http://localhost:5296)
// Without CORS, browsers block requests between different ports for security reasons
builder.Services.AddCors(options =>
{
    options.AddPolicy("cors", p => p
        .AllowAnyOrigin()      // Allow requests from any domain
        .AllowAnyHeader()      // Allow any HTTP headers
        .AllowAnyMethod()      // Allow GET, POST, PUT, DELETE, etc.
    );
});
// Register LINQ2DB with MySQL provider
builder.Services.AddLinqToDB(
    (sp, options) =>
        options.UseMySql(
            builder.Configuration.GetConnectionString("MySqlConn"),
            MySqlVersion.MySql80,
            MySqlProvider.MySqlConnector
        )
);
// Register AppDataConnection for dependency injection
builder.Services.AddScoped<AppDataConnection>();
var app = builder.Build();

// Apply CORS policy
app.UseCors("cors");

app.UseAuthorization();

app.MapControllers();

app.Run();
Explanation:
-
AddControllers(): Registers MVC controllers for HTTP routing. -
AddNewtonsoftJson(): Enables JSON serialization with Newtonsoft. -
AddCors(): Configures CORS to allow Vue frontend (different origin) to make requests. -
AddLinqToDB(): Registers LINQ2DB with MySQL configuration. -
AddScoped<AppDataConnection>(): Registers our connection class for dependency injection. -
app.MapControllers(): Routes incoming requests to controller methods.
The backend API is now configured.
Integrating Vue Diagram
The following steps describe how to render the Diagram and connect it to the MySQL Server back-end.
Step 1: Creating the Vue client application
Create the Vue client application using the following commands in a Visual Studio Code terminal or command prompt:
npm create vite@latest diagram_mysql.client -- --template vue-ts
cd diagram_mysql.client
This command scaffolds a new Vue application using Vite.
Step 2: Adding Syncfusion® packages
Install the required Syncfusion® packages by running the following commands:
npm install @syncfusion/ej2-vue-diagrams --save
After installation, the necessary CSS files are available in the node_modules directory.
Add the required CSS references to the src/style.css file to apply styling to the Diagram component.
@import "../node_modules/@syncfusion/ej2-vue-diagrams/styles/bootstrap5.3.css";
@import "../node_modules/@syncfusion/ej2-base/styles/bootstrap5.3.css";
@import "../node_modules/@syncfusion/ej2-popups/styles/bootstrap5.3.css";
@import "../node_modules/@syncfusion/ej2-navigations/styles/bootstrap5.3.css";
For this project, the “Bootstrap 5.3” theme is applied. Other themes can be selected, or the existing theme can be customized to meet specific project requirements. For detailed guidance on theming and customization, refer to the Syncfusion® Vue Components Appearance documentation.
Step 3: Add Vue Diagram
Create a basic Diagram component in src/App.vue:
<template>
  <div>
    <ejs-diagram id="diagram" width="100%" height="600px"></ejs-diagram>
  </div>
</template>

<script lang="ts">
import { DiagramComponent } from "@syncfusion/ej2-vue-diagrams";
export default {
  components: { "ejs-diagram": DiagramComponent }
};
</script>
Step 4: Configure remote data binding
Remote data binding enables the diagram to fetch organizational chart data from the ASP.NET Core backend endpoint. The DataManager service handles communication with the server, while property mappings link database columns to diagram nodes.
Add the data binding configuration to DiagramComponent:
<template>
  <div>
    <ejs-diagram
      id="diagram"
      width="100%"
      height="600px"
      :snapSettings="{ constraints: SnapConstraints.None }"
      :layout="{ type: 'OrganizationalChart' }"
      :dataSourceSettings="dataSourceSettings"
    ></ejs-diagram>
  </div>
</template>

<script lang="ts">
import { DiagramComponent, DataBinding, HierarchicalTree, SnapConstraints } from "@syncfusion/ej2-vue-diagrams";
import type { NodeModel, ConnectorModel } from "@syncfusion/ej2-diagrams";
import { DataManager } from "@syncfusion/ej2-data";

export interface Employee {
  id: number;
  name: string;
  parentId?: number | null;
}

// Create DataManager instance pointing to your backend API
const dataManager = new DataManager({
  // Check your actual backend port from Properties/launchSettings.json in the ASP.NET project
  url: "http://localhost:5296/api/diagram/items",
});

export default {
  components: { "ejs-diagram": DiagramComponent },
  provide: { diagram: [DataBinding, HierarchicalTree] },
  data() {
    return {
      SnapConstraints,
      dataSourceSettings: {
        // Maps database column (Id) to uniquely identify each node
        id: "id",
        // Maps database column (ParentId) to establish parent-child relationships
        parentId: "parentId",
        // DataManager pointing to the API endpoint that returns employee data
        dataSource: dataManager,
        // Callback function that customizes node appearance with employee information
        doBinding: (nodeModel: NodeModel, data: Employee) => {
          nodeModel.annotations = [{
            content: data.name,
            style: { color: '#FFFFFF' }
          }];
        }
      }
    };
  }
};
</script>
Step 5: Inject required services
Provide the required services using provide in the component:
// ...existing code...
export default {
  // ...existing options...
  provide: { diagram: [DataBinding, HierarchicalTree] }
}
// ...existing code...
Complete code
Here is the complete src/App.vue file:
<template>
  <div>
    <ejs-diagram
      id="diagram"
      width="100%"
      height="600px"
      :snapSettings="{ constraints: SnapConstraints.None }"
      :layout="{ type: 'OrganizationalChart' }"
      :dataSourceSettings="dataSourceSettings"
      :getNodeDefaults="getNodeDefaults"
      :getConnectorDefaults="getConnectorDefaults"
    >
    </ejs-diagram>
  </div>
</template>

<script lang="ts">
import { DiagramComponent, DataBinding, HierarchicalTree, SnapConstraints } from "@syncfusion/ej2-vue-diagrams";
import type { NodeModel, ConnectorModel } from "@syncfusion/ej2-diagrams";
import { DataManager } from "@syncfusion/ej2-data";

export interface Employee {
  id: number;
  name: string;
  parentId?: number | null;
}

const dataManager = new DataManager({
  // Check your actual backend port from Properties/launchSettings.json in the ASP.NET project
  url: "http://localhost:5296/api/diagram/items",
});

export default {
  components: { "ejs-diagram": DiagramComponent },
  provide: { diagram: [DataBinding, HierarchicalTree] },
  data() {
    return {
      SnapConstraints,
      dataSourceSettings: {
        //  Maps the database column (`Id`) to uniquely identify each node.
        id: "id",
        // Maps the database column (`ParentId`) to establish parent-child relationships.
        parentId: "parentId",
        // DataManager pointing to the API endpoint that returns employee data.
        dataSource: dataManager,
        // Callback function that customizes node appearance
        doBinding: (nodeModel: NodeModel, data: Employee) => {
          nodeModel.annotations = [{
            content: data.name,
            style: { color: '#FFFFFF' }
          }];
        }
      }
    };
  },
  methods: {
    getNodeDefaults(node: NodeModel) {
      node.width = 120;
      node.height = 40;
      node.style = { fill: '#1F3A8A', strokeColor: '#1E40AF' };
      return node;
    },
    getConnectorDefaults(connector: ConnectorModel) {
      connector.type = 'Orthogonal';
      connector.cornerRadius = 7;
      connector.targetDecorator = { shape: 'None' };
      connector.style = {
        strokeColor: '#94A3B8',
        strokeWidth: 1.5
      };
      return connector;
    }
  }
};
</script>
Running the complete application
Starting the ASP.NET Core backend
Open a terminal and navigate to the backend project:
cd Diagram_MySQL.Server
Start the backend server:
dotnet run
Starting the Vue frontend
Open a new terminal and navigate to the frontend project:
cd diagram_mysql.client
Start the Vue development server:
npm run dev
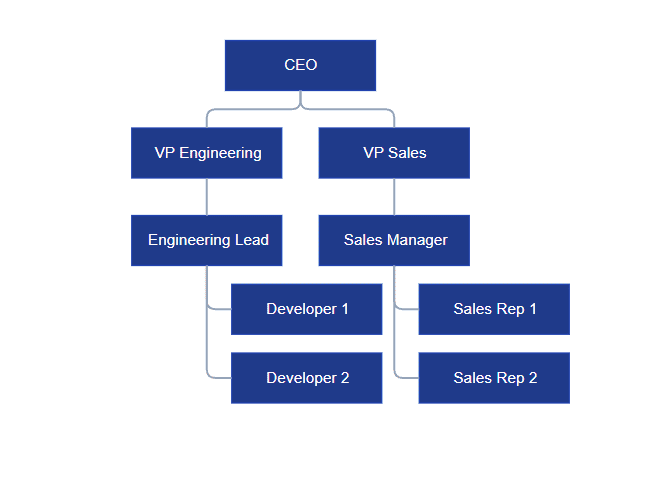
Troubleshooting
Blank page in browser tab
- Verify services and processes
- Verify the Windows service is running: press Win+R, run services.msc, and confirm MySQL80 (or your service name) is running.
- Ensure the ASP.NET backend is running. If not, run:
dotnet run
- Verify backend binding and endpoint
- Verify the MySQL connection string in appsettings.json:
Server,Port,Database,User Id, andPasswordmust match your MySQL setup. - Check the backend ports in Properties/launchSettings.json (look for
applicationUrl):"applicationUrl": "https://localhost:7092;http://localhost:5296"Use the HTTP port to test the endpoint in browser: http://localhost:5296/api/diagram/items
Expected JSON response:
[
  {"id":1,"name":"CEO","parentId":null},
  {"id":2,"name":"VP Engineering","parentId":1}
]
The API must return a JSON array of objects containing the
id,parentId, andnamefields (match casing used indataSourceSettings).
- Verify the MySQL connection string in appsettings.json:
- Check frontend configuration
- Confirm
dataSourceSettingsproperty names match the API JSON casing (id,parentId,name). - Confirm the DataManager/service URL uses the correct HTTP port, e.g.: http://localhost:5296/api/diagram/items
- Confirm
Application shows the diagram twice
- Stop the Vue client application (press Ctrl+C in the terminal where it’s running) and then restart it:
npm run dev
Complete sample repository
A fully functional working sample of this project is available on GitHub Repository
You can clone the sample repository, update the MySQL connection string, and run both projects to view the organizational chart locally.