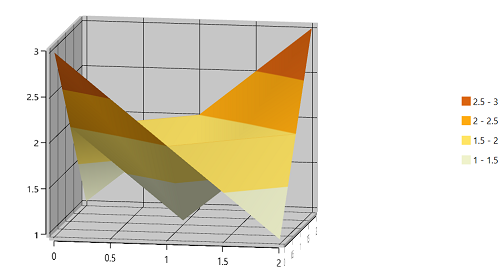
ColorBar in WPF Surface Chart
The ColorBar is used to represent the value range in a surface via colors. You can define a color bar for the surface chart as shown in the following code example.
The color bar position can be customized using the DockPosition property.
The color bar can either show or hide the labels, and this can be done using the ShowLabel property.
<chart:SfSurfaceChart ItemsSource="{Binding DataValues}"  XBindingPath="X"
                              YBindingPath="Y" ZBindingPath="Z" RowSize="{Binding RowSize}"
                              ColumnSize="{Binding ColumnSize}">

            <chart:SfSurfaceChart.ColorBar>
                <chart:ChartColorBar ShowLabel="True" DockPosition="Right"></chart:ChartColorBar>
            </chart:SfSurfaceChart.ColorBar>

        </chart:SfSurfaceChart>
SfSurfaceChart chart = new SfSurfaceChart();
chart.SetBinding(SfSurfaceChart.ItemsSourceProperty, "DataValues");
chart.SetBinding(SfSurfaceChart.RowSizeProperty, "RowSize");
chart.SetBinding(SfSurfaceChart.ColumnSizeProperty, "ColumnSize");
chart.XBindingPath = "X";
chart.YBindingPath = "Y";
chart.ZBindingPath = "Z";
ChartColorBar colorBar = new ChartColorBar();
colorBar.DockPosition = ChartDock.Right;
colorBar.ShowLabel = true;
chart.ColorBar = colorBar;
grid.Children.Add(chart);The following image represents the color bar at the right side of the surface chart.